
Lissajou Curves
This is an article about Lissajous Curves.
Lissajous curves (sometimes also known as Lissajous figures or Bowditch curves), are pretty shapes first investigated by Nathaniel Bowditch in 1815, and later (and in much more detail) by Jules Antoine Lissajou in 1857. Liassajou curves are described by the parametric equations below:

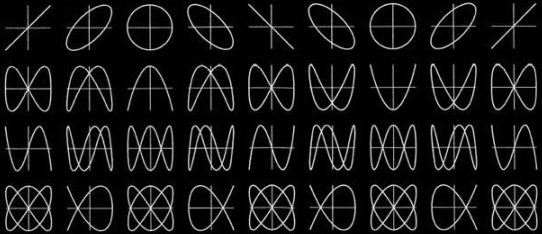
They are the shapes created when the x-coordinate of a curve is described by one sine wave, and the y-coordinate is described by another sine wave. By adjusting the frequency of each wave, the phase between them, and their relative amplitudes, interesting patterns emerge.
 |
Sine Waves We are taught in school that a sine function is generated by sweeping a line around in a circle and looking at the resolved component of this against a linear access. (A cosine function, which is generated by looking at the component in an orthogonal axis for a circle, is just sine wave phase shifted by π/2). Lissajou figures are created by the combination of two sine waves. You can imagine sweeping a pencil side-to-side in a sinusoidal motion (adjusting just the x-axis), and what you would get is a straight line. Now, at the same time as moving it side-to-side, if you moved the pencil up-and-down with a different sinusoidal motion, you'd get a two dimensional pattern.
Adjusting the amplitude of each multiplying coefficient (A and B) adjust the scale/size of the shape in the corresponding axis. By adjusting the relative frequencies (a and b), and the phase (δ) between the waves, different shapes are created. |
|
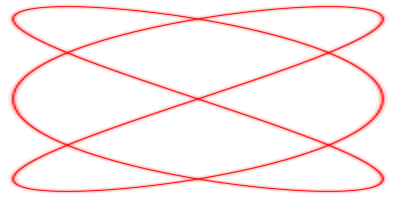
When the ratio of frequencies a/b is rational, closed form shapes are generated and, depending on the relative ratios, they might look like pretzels or knots. To the right is an example where the frequency ratio between the two waves is 3/2, and the amplitude ratio is 2:1 (with a phase difference of π/2). You can count three lobes in the vertical plane, and two lobes in the horizontal plane; the ratio of the two frequencies. |
|
Same frequency (a=b)
|
If the two waves are exactly the same frequency, and perfectly in phase, then at all points the x-value will be same as the y-value. The output will be a straight diagonal line y=x. If the two waves are exactly the same frequency, but out of synch by π/2, then one of the waves will be like a cosine, and the resultant output will be a circle (or an ellipse if the amplitude of the signals is different). When I was at school we were taught about Lissajou using oscilloscopes and two signal generators. Oscilloscopes have an XY mode such that allows the trace to controlled using two distinct inputs (instead of the traditional y-input and a regular timebase). 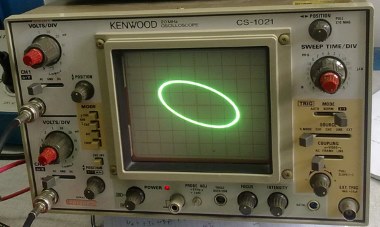 Image: snamepi Image: snamepi
|
 Image: Fiducial Image: Fiducial |
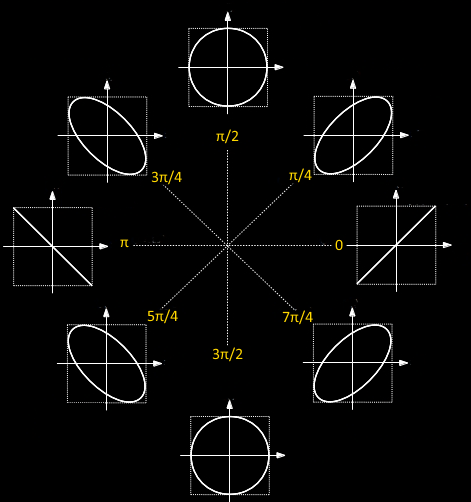
As the phase between the two waves (of the same frequency) changes, the resulting output shape changes between a circle, when the waves are π/2 out of phase (in either direction), or a straight line when either then are in phase, or a straight line in the opposite direction (when they are exactly π out of phase). In-between these two are various distorted ellipses.
Engineers can use the principles of Lissajou to precisely tune and set up the phase relation between a known reference signal and a signal to be tested.
Different frequencies
When the ratio of the frequencies is a non-unity rational ratio, more complex shapes are generated. They are closed shapes. As before, the ratio of the major lobes shows the ratio of the frequencies.
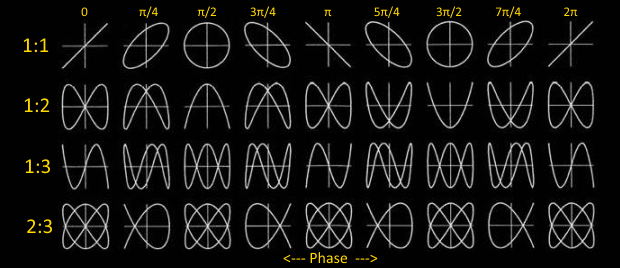
(If the ratio is not a rational ratio, the shape is a not closed but do to the persistence of vision, it appears like a 'rotating' shape when viewed).
Try it yourself
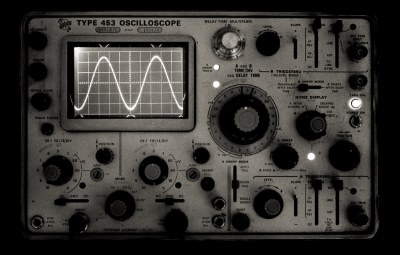 Image: stanua Image: stanua |
Below is an applet to allow you to experiment with Lissajou figures. Using the buttons [1x], [2x], [3x] … you can adjust the ratio of the frequencies. There are buttons to control the horizontal frequency, and buttons for the vertical. In automatic mode, the frequencies slowly change in phase to animate the shapes. If you switch the app into manual mode, you can set the phase directly in the app by clicking and dragging over the output (left to right). Dragging to the extreme left sets the phase to 0. Dragging all the way to the right sets the phase to 2π. On the right, on vertical yellow axes, you can see depictions of the waves that generate the image. Below these is a 'radar' sweep showing the phase lag between the two signals (when the line is pointing directly to the right, it depicts zero phase difference). |
Finally, for a bit of variety, it's possible to switch each waves from a sine wave to a triangular wave.
You can find a complete list of all the articles here. Click here to receive email alerts on new articles.
© 2009-2015 DataGenetics Privacy Policy