
| Home | Blog | About Us | Work | Content | Contact Us |
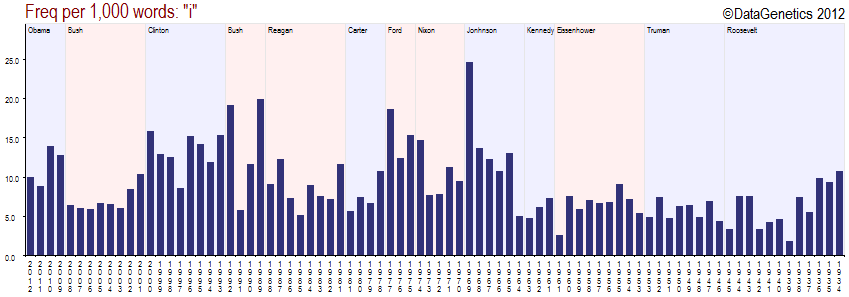
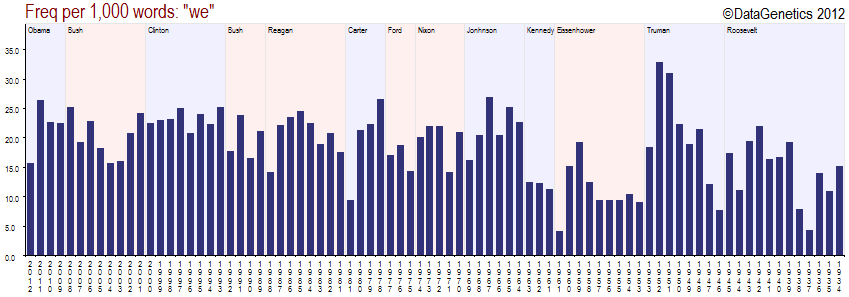
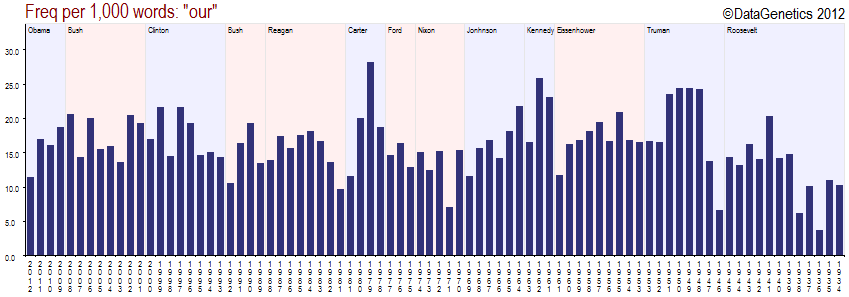
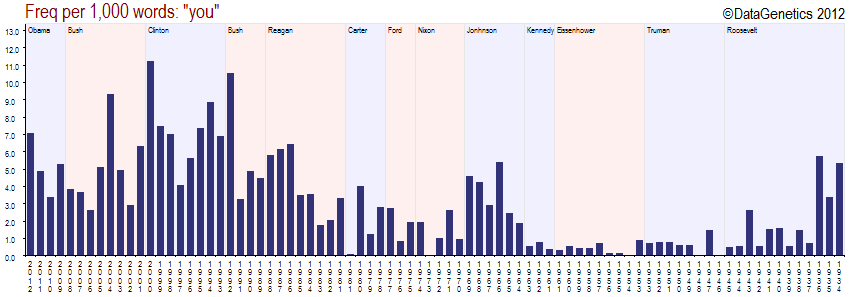
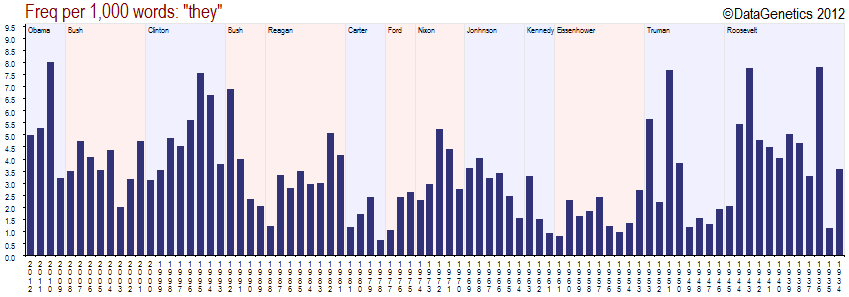
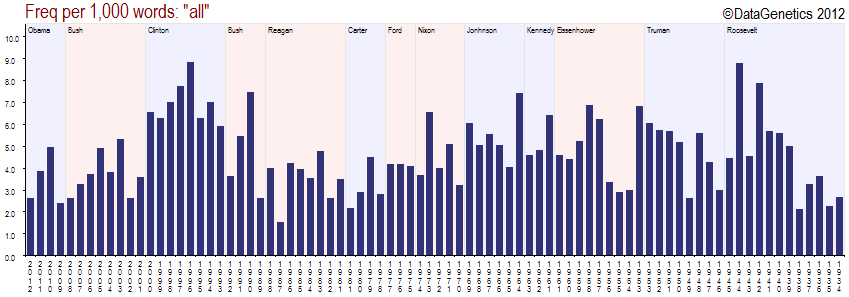
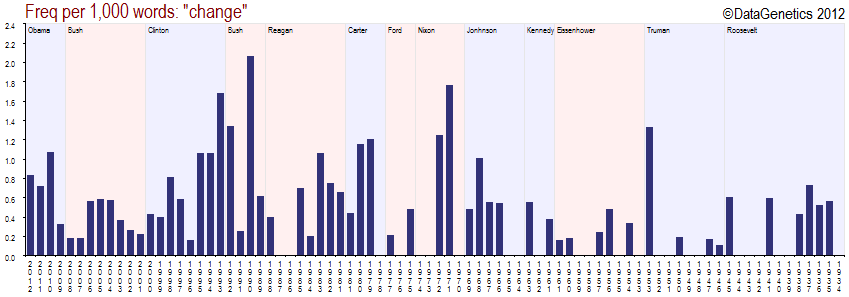
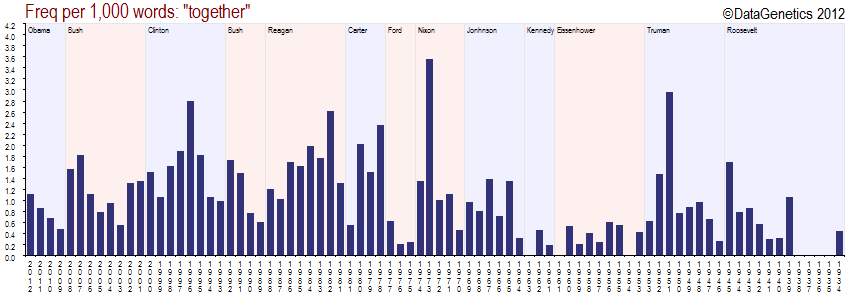
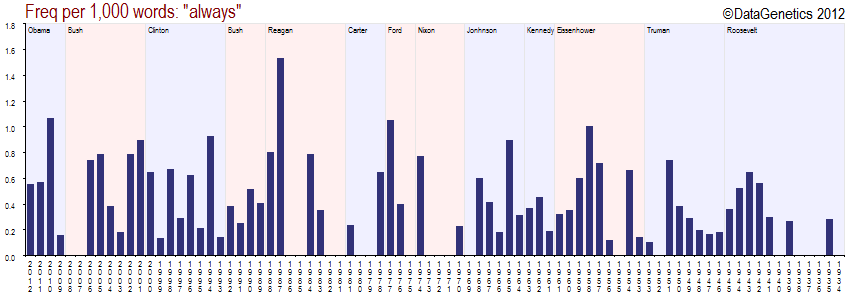
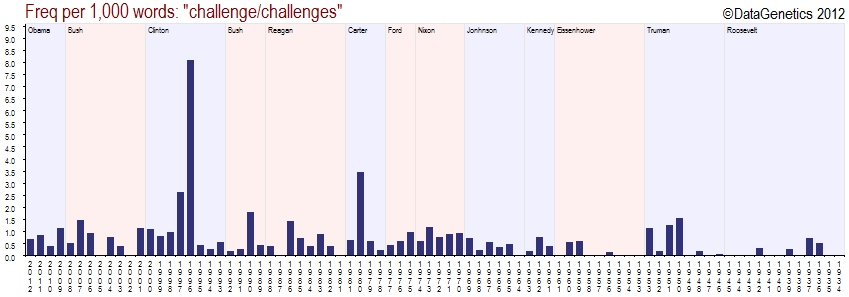
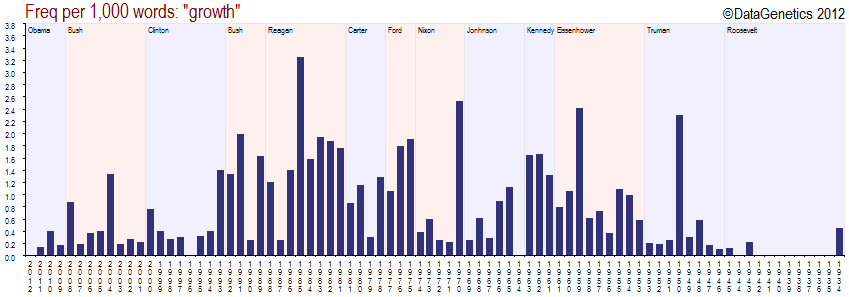
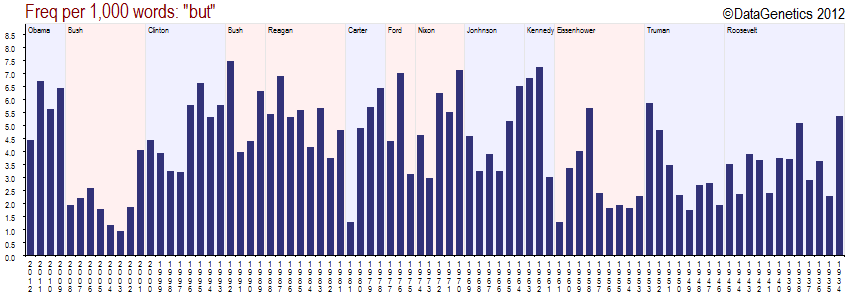
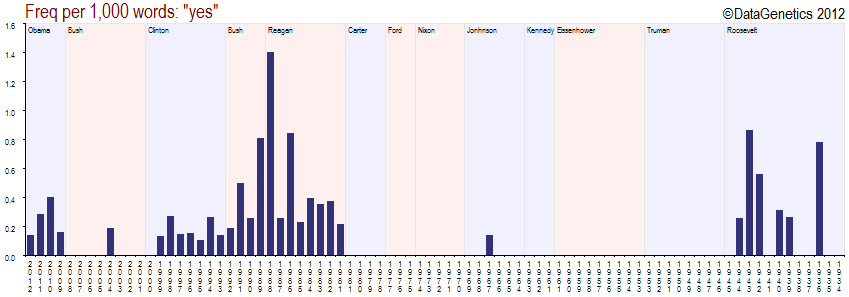
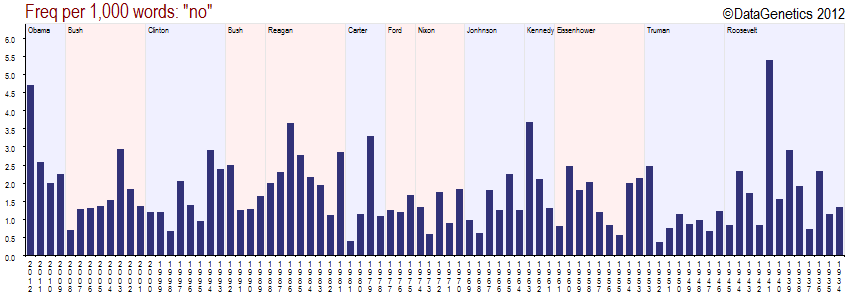
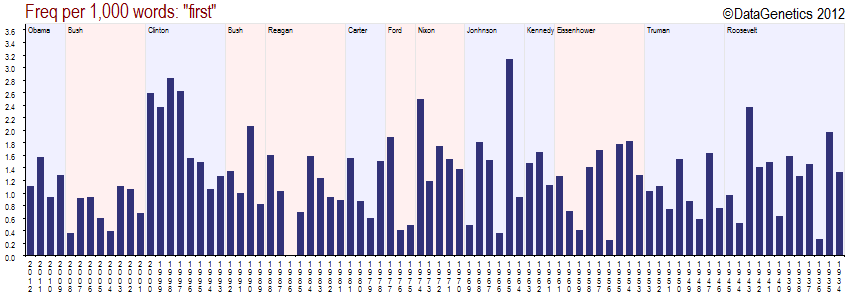
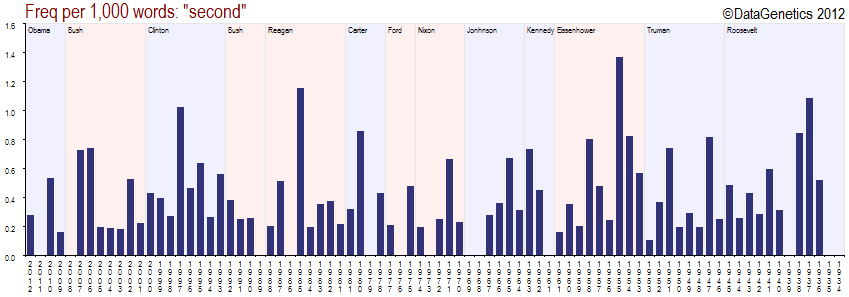
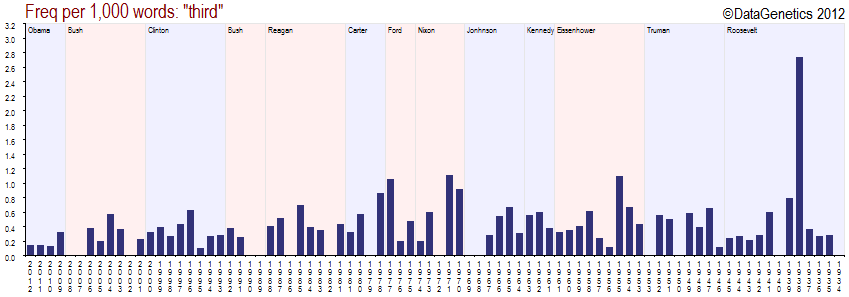
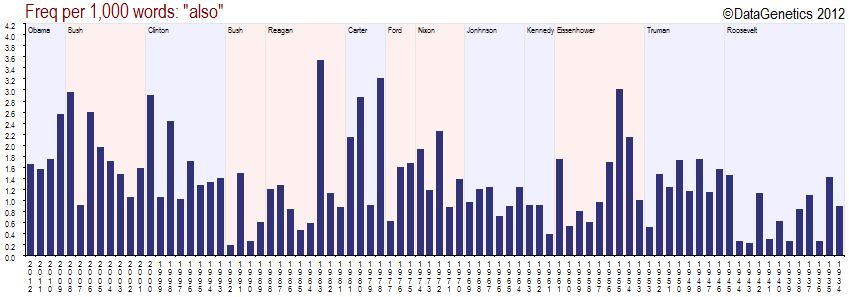
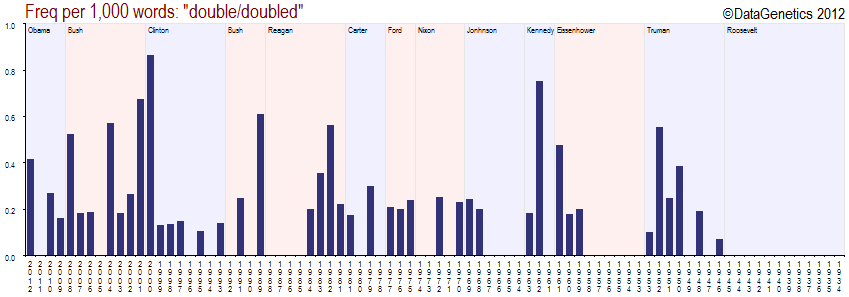
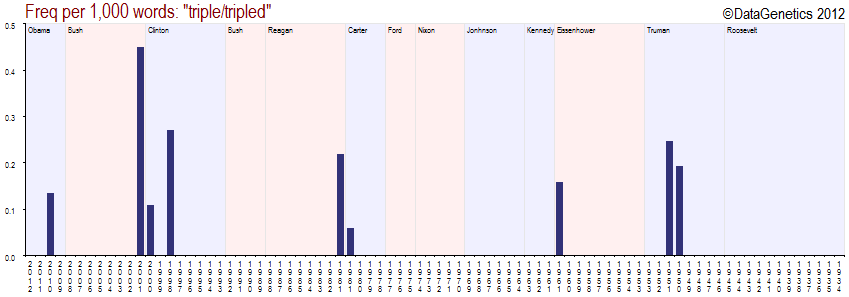
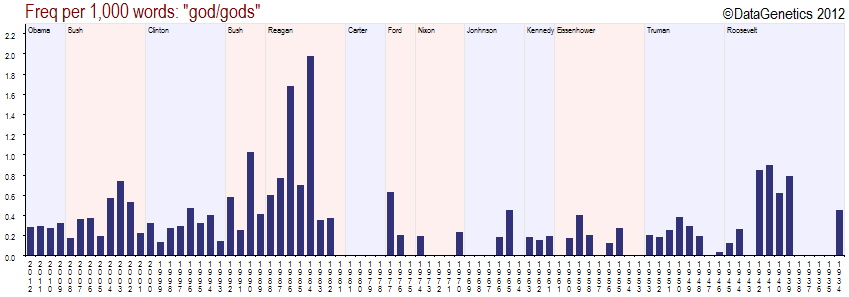
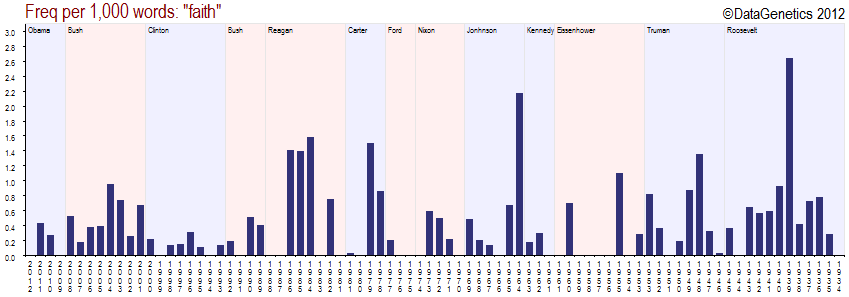
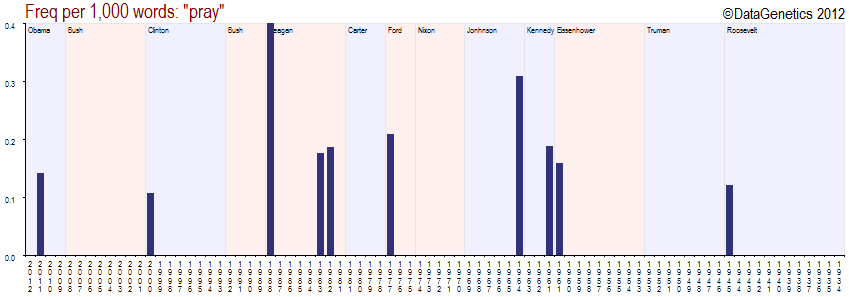
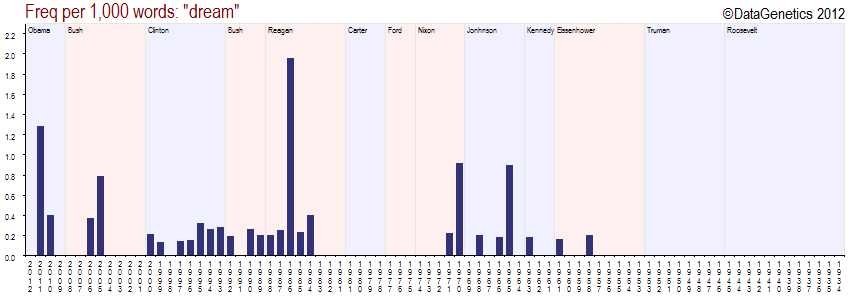
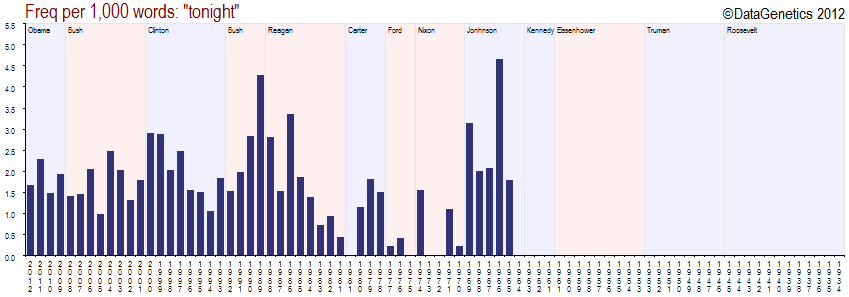
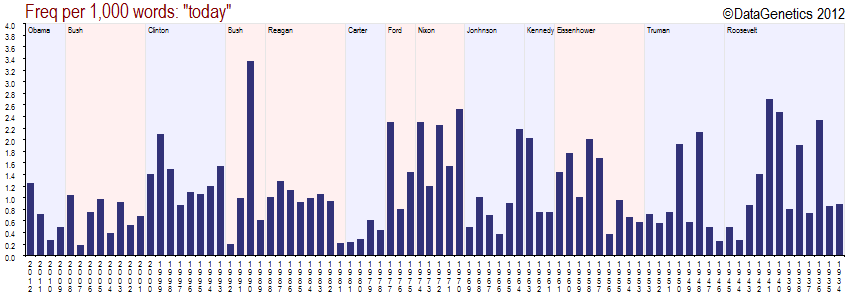
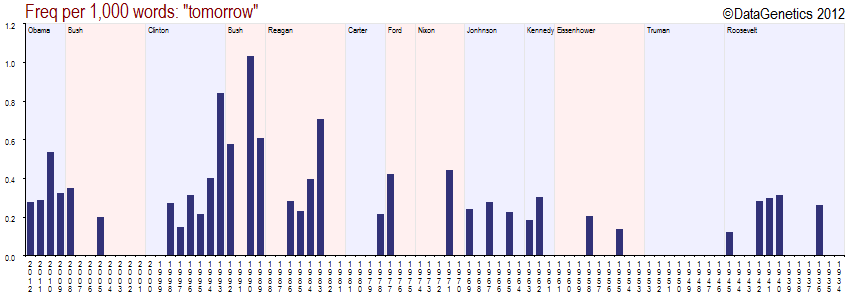
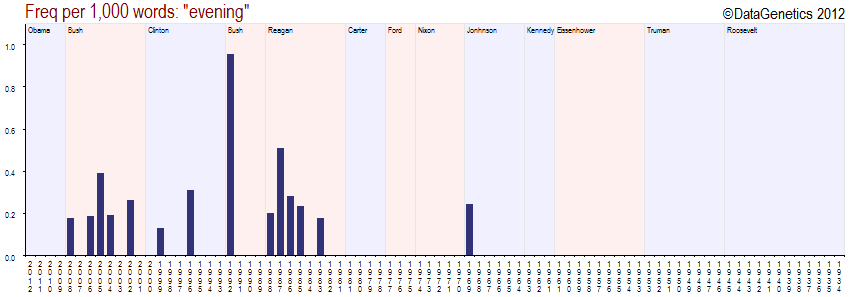
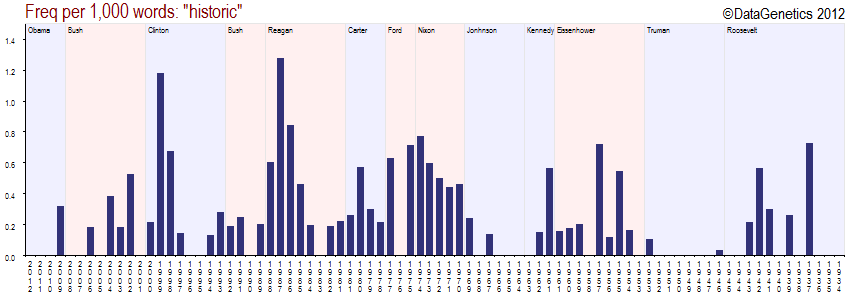
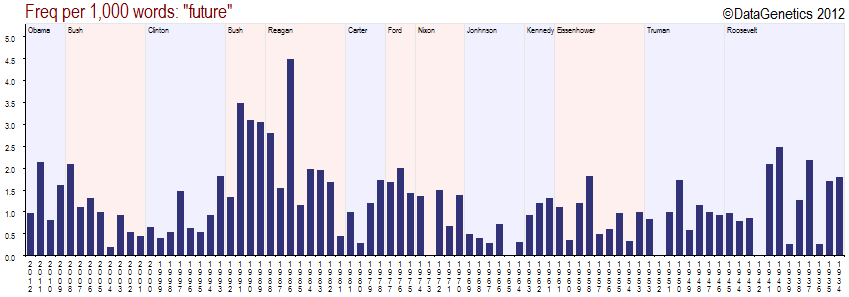
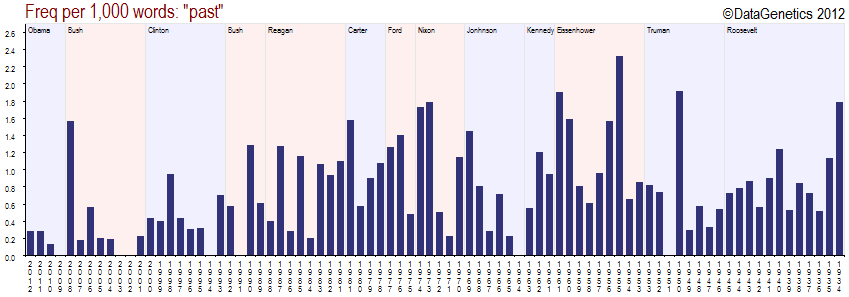
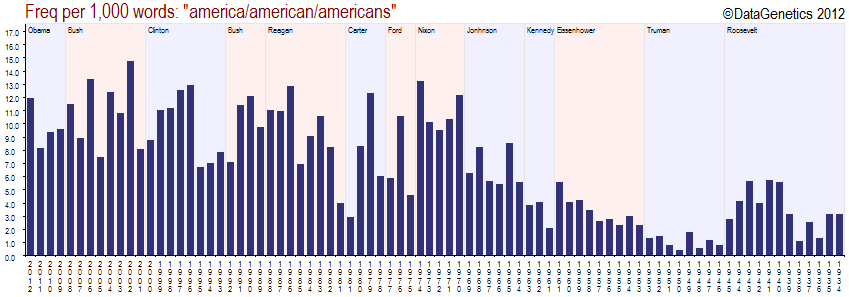
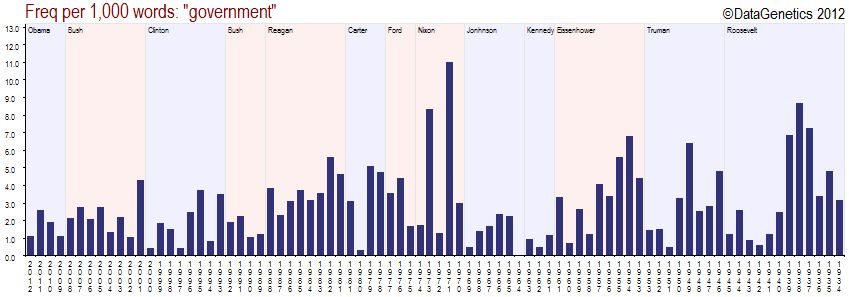
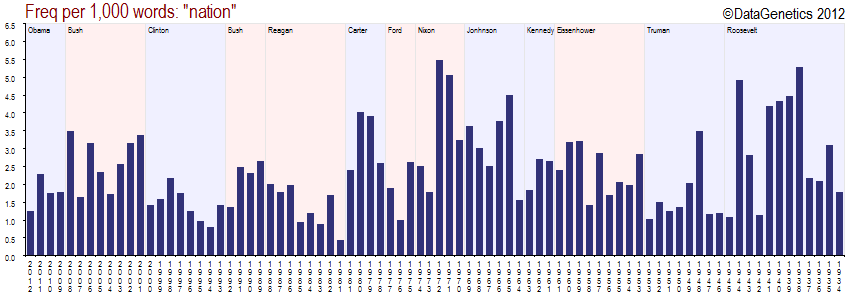
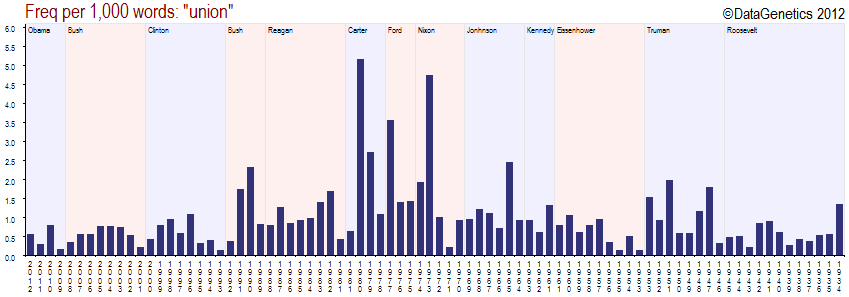
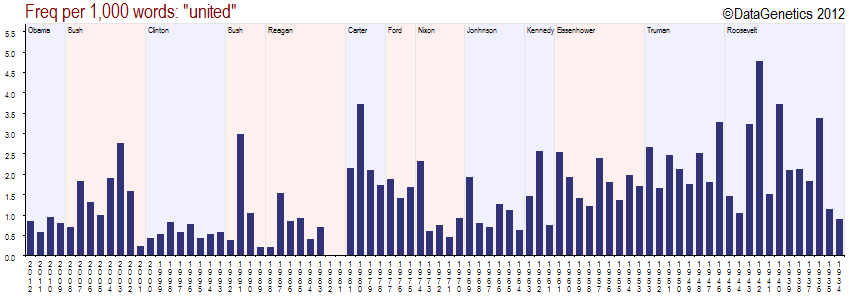
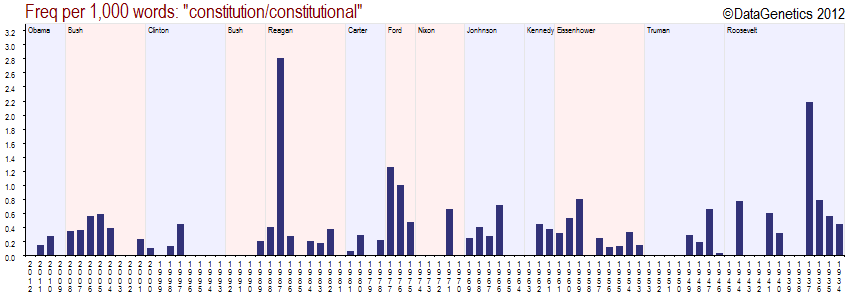
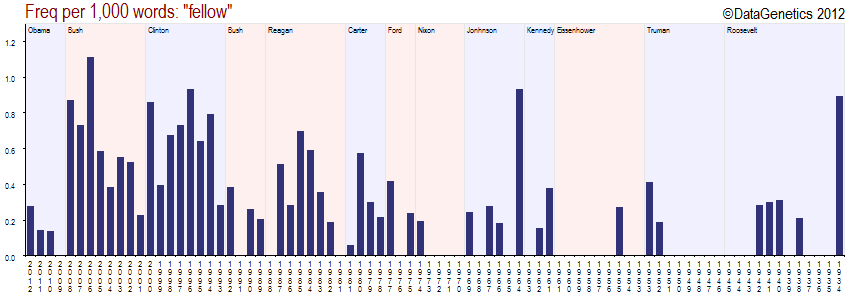
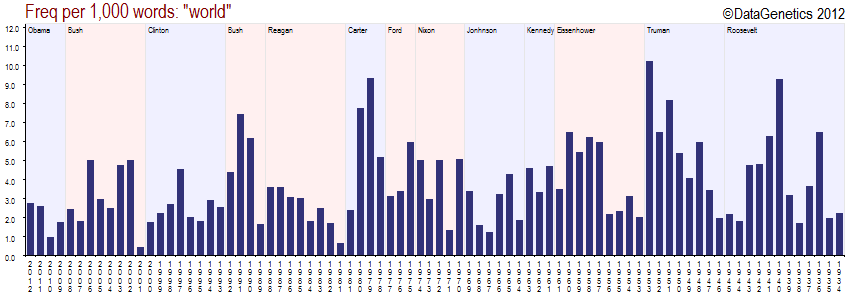
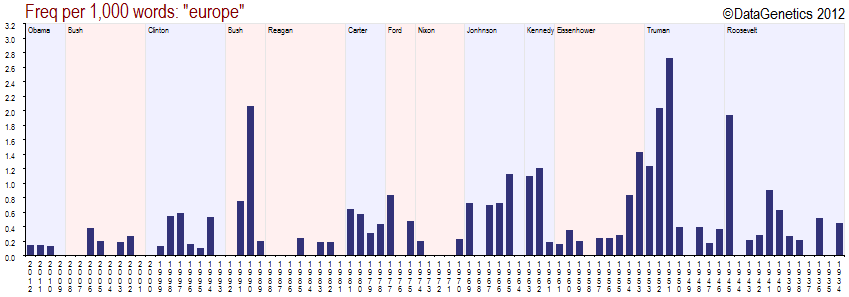
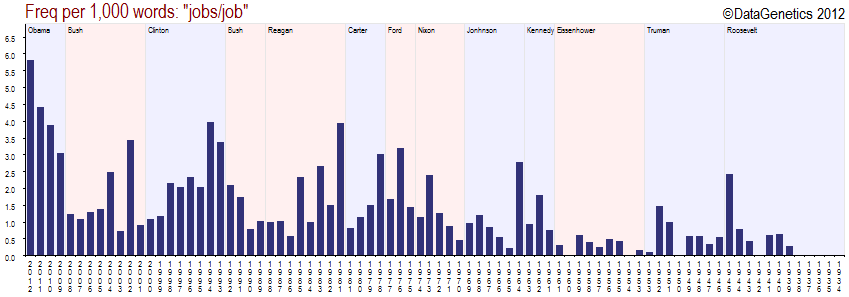
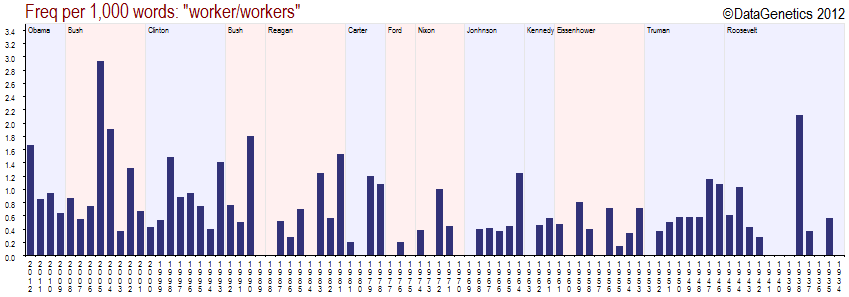
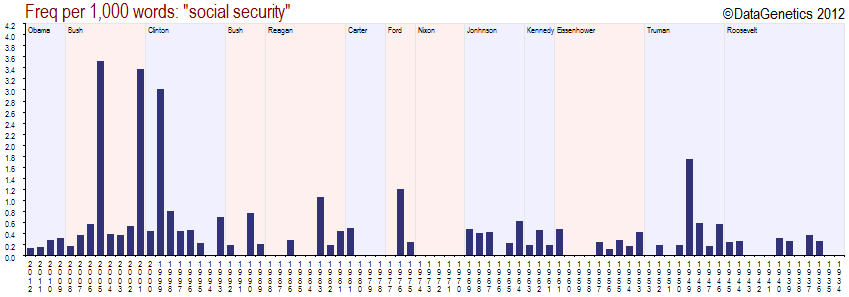
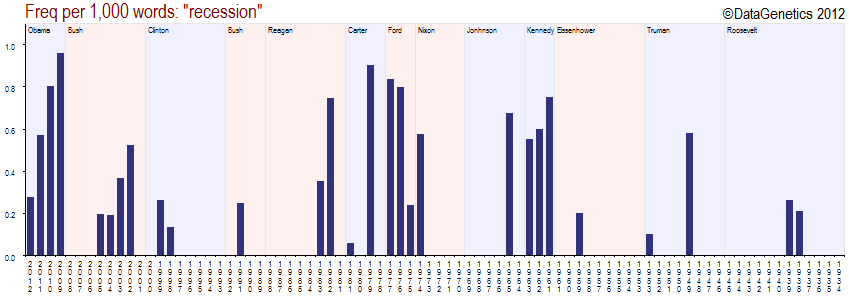
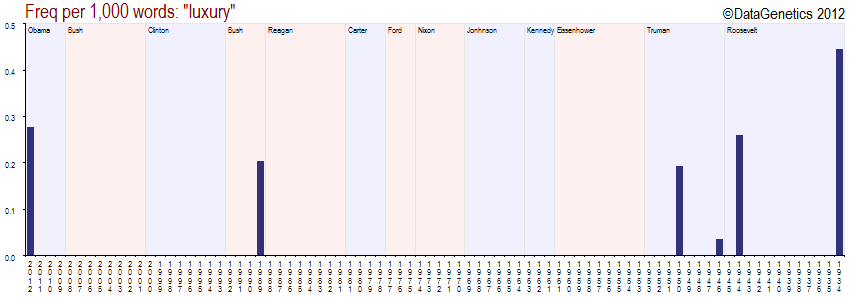
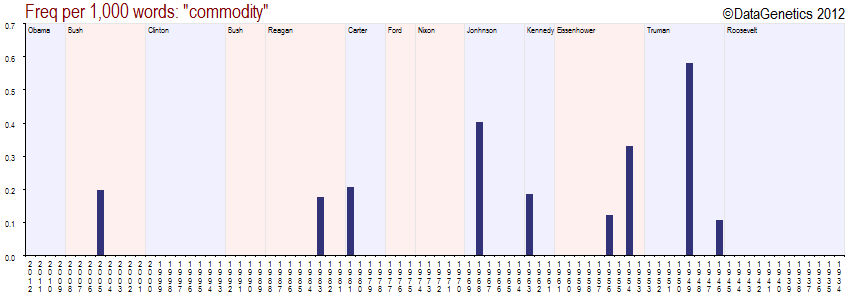
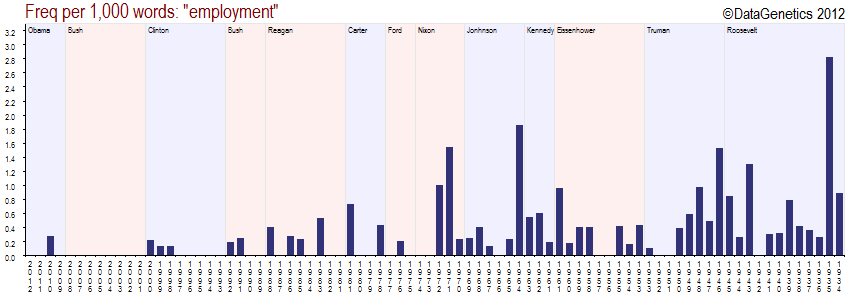
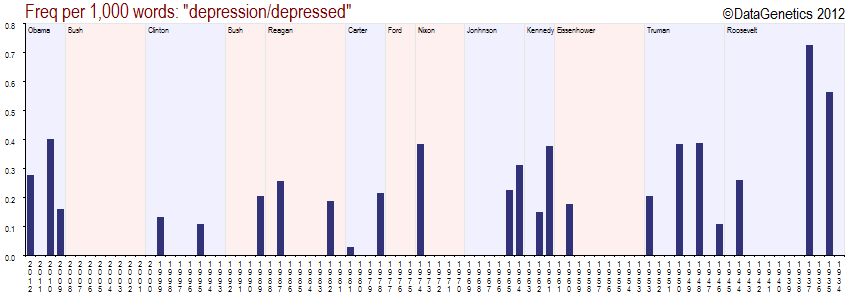
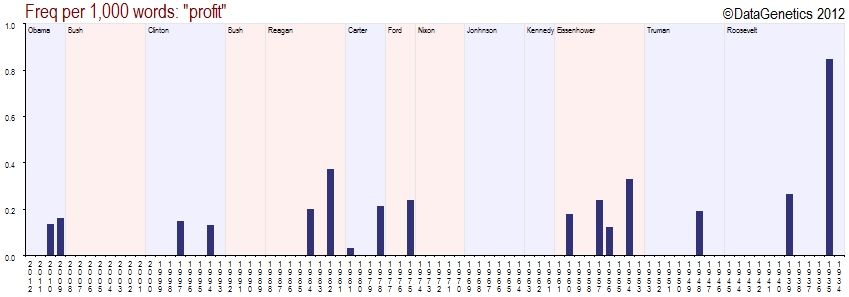
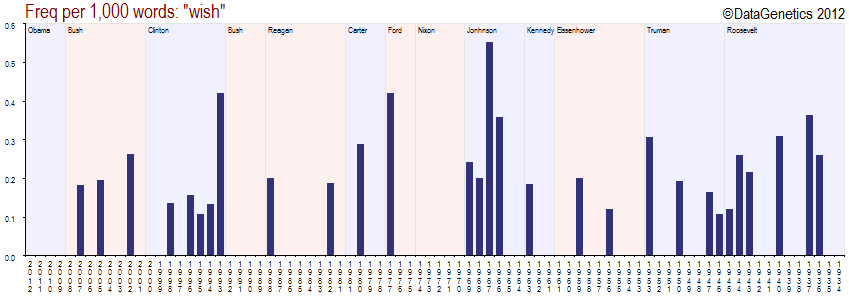
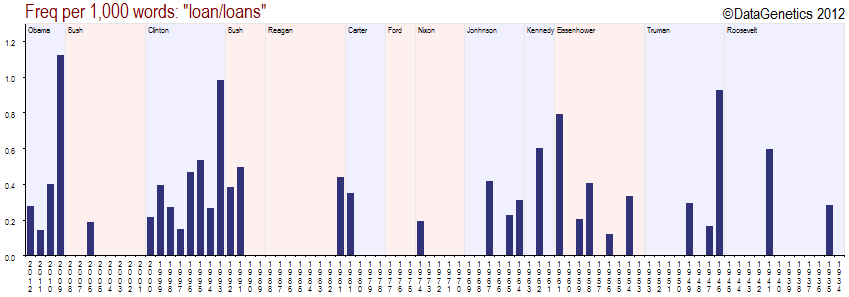
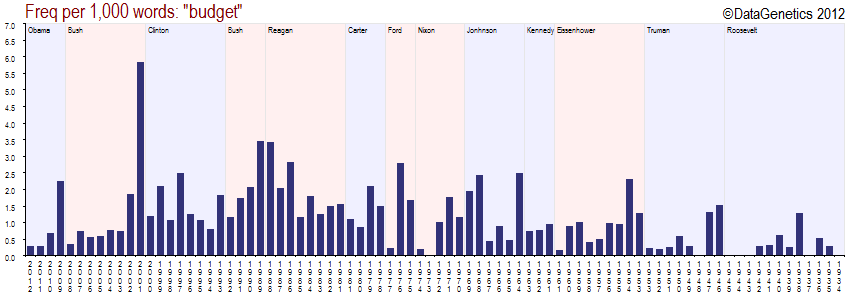
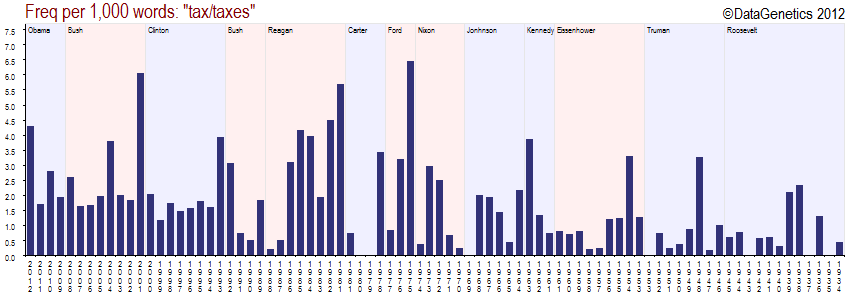
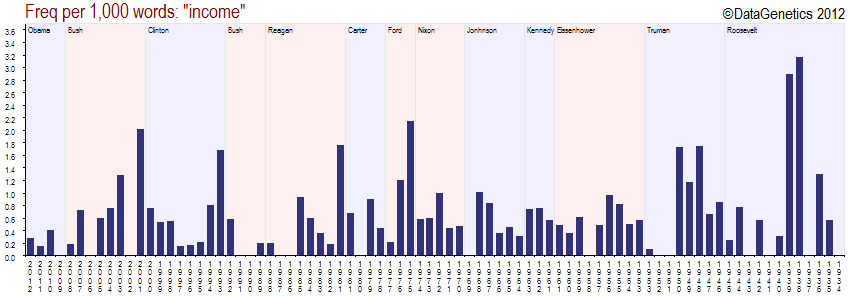
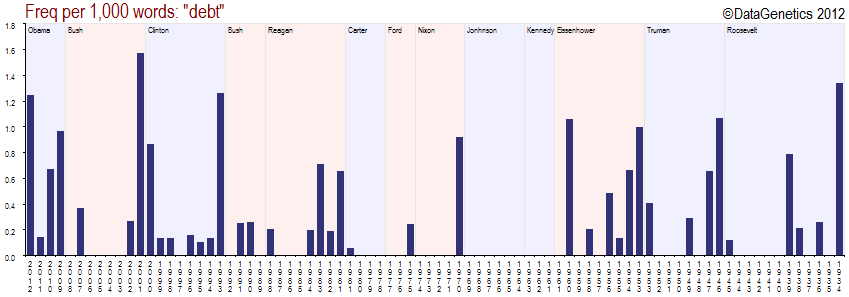
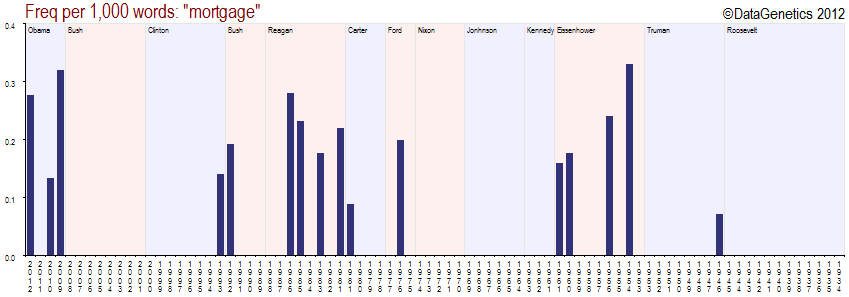
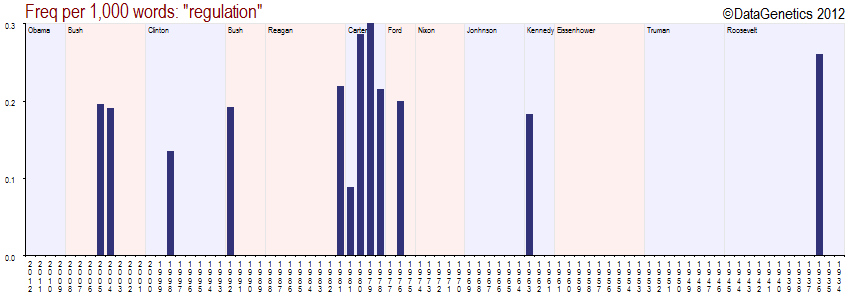
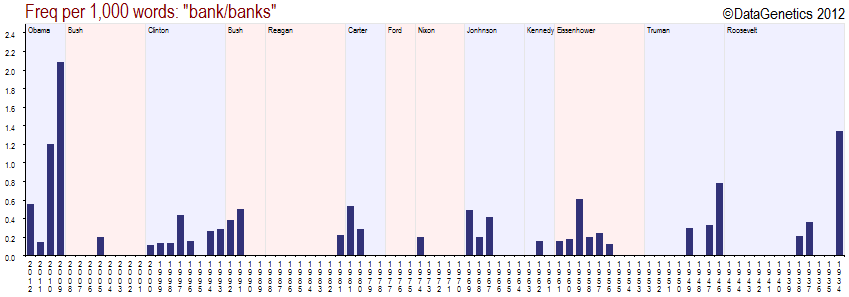
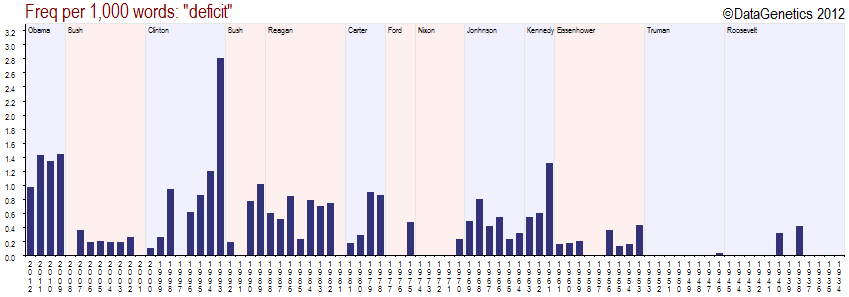
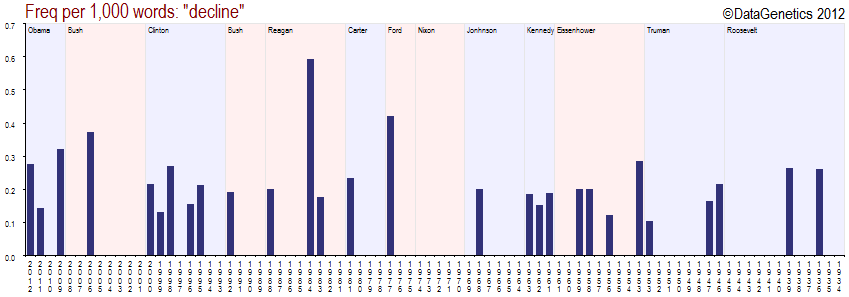
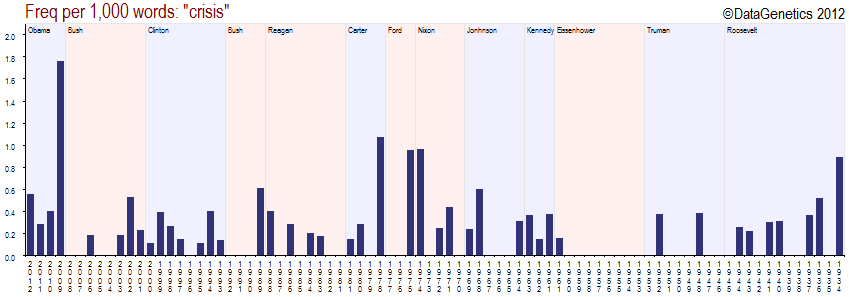
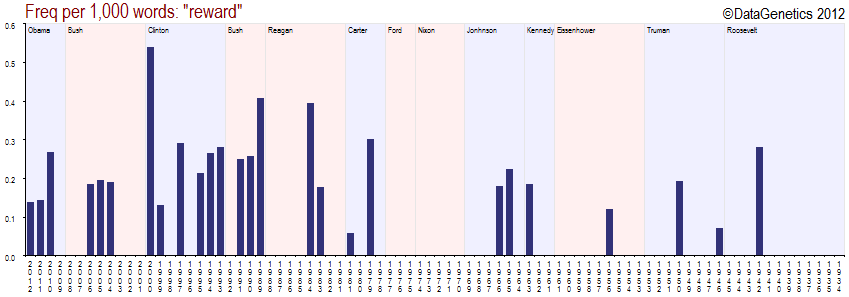
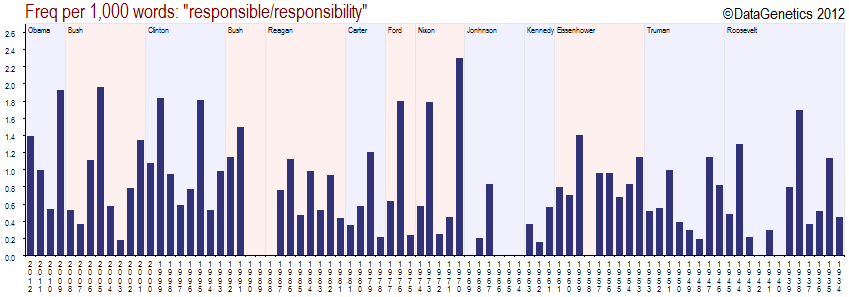
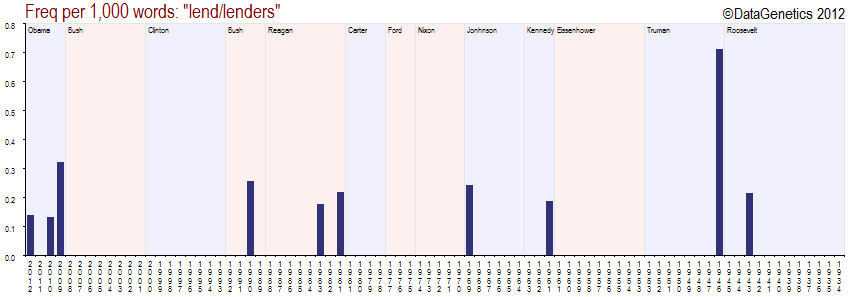
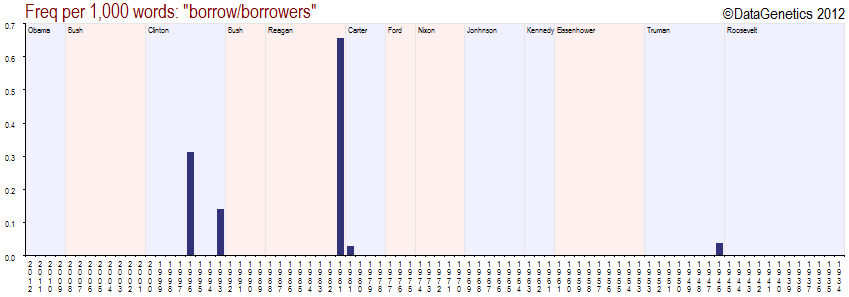
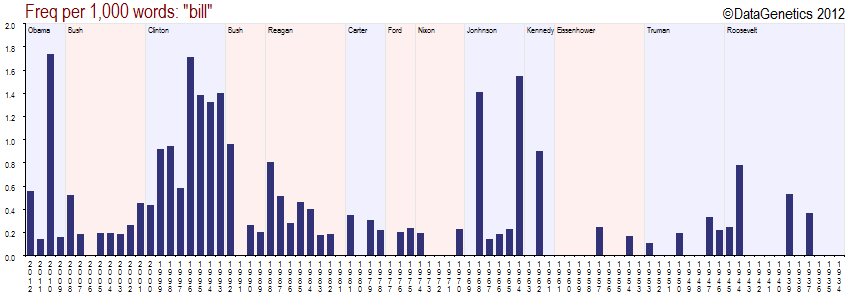
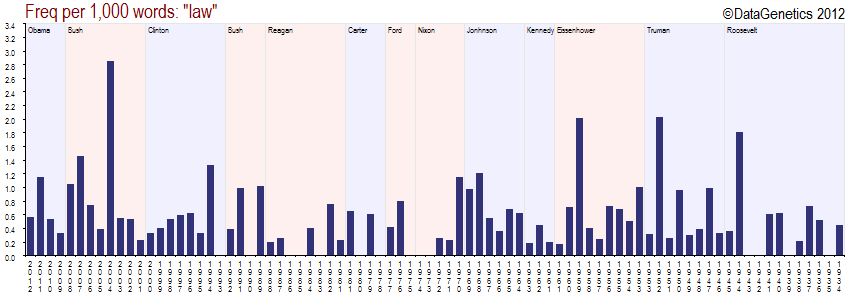
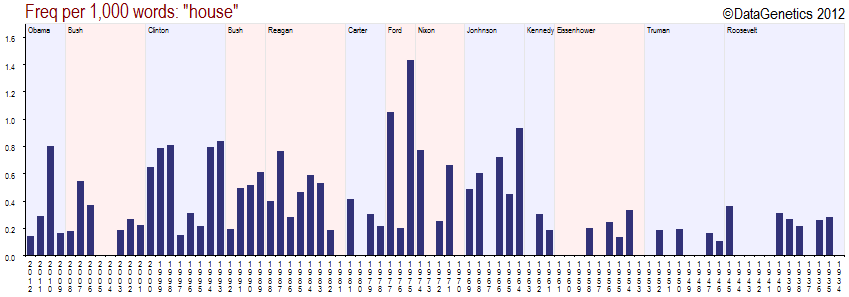
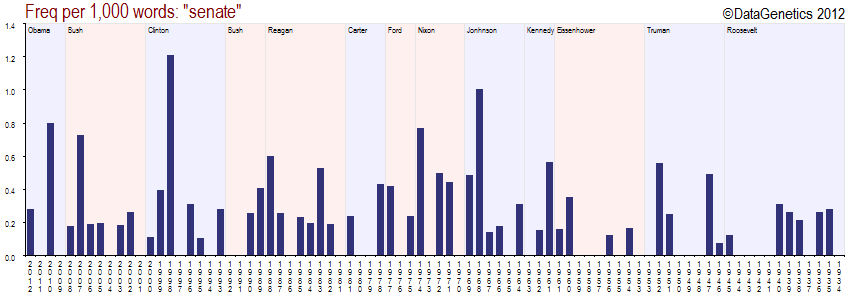
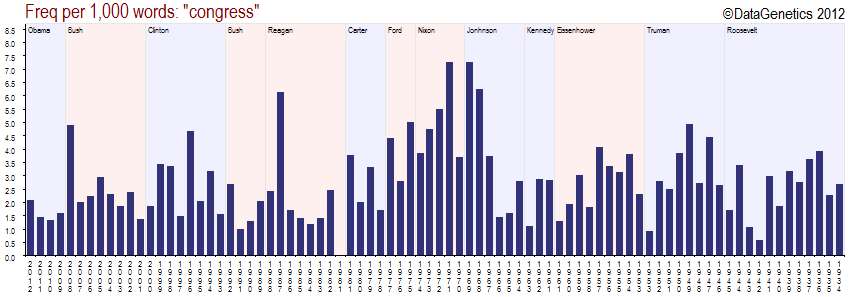
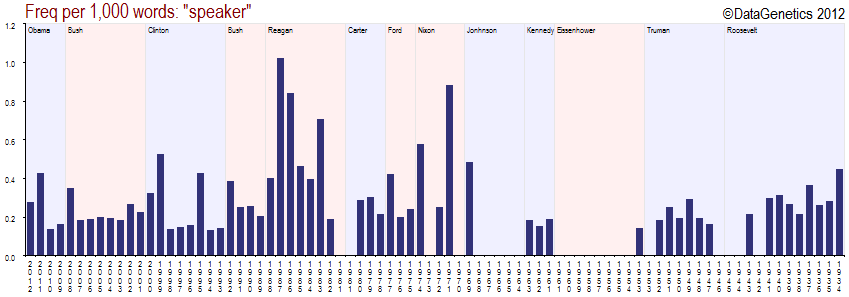
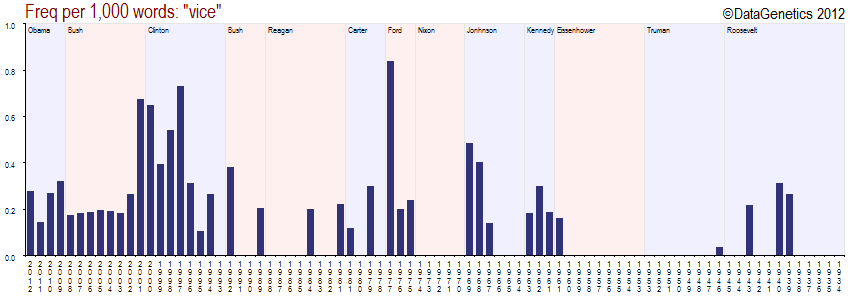
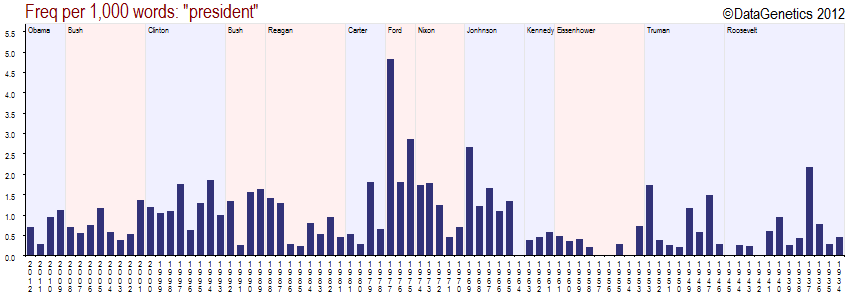
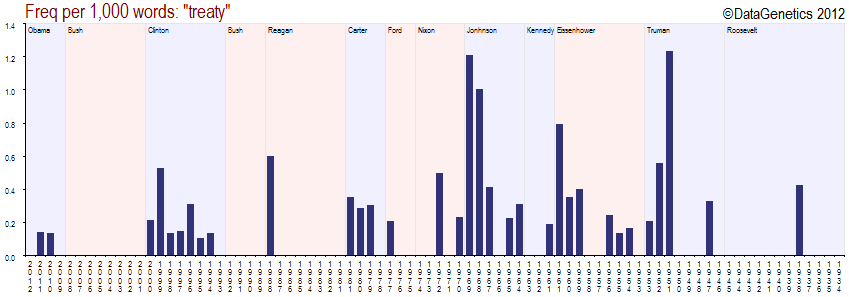
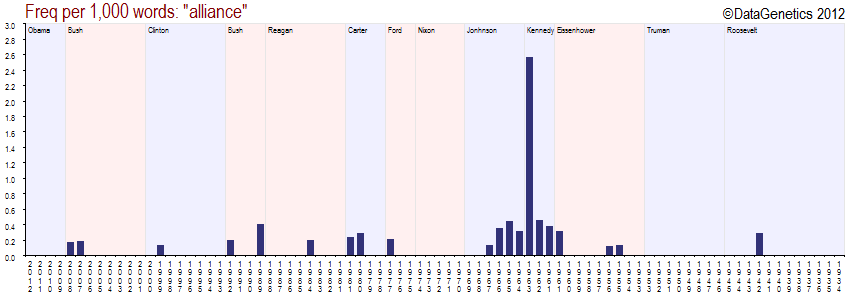
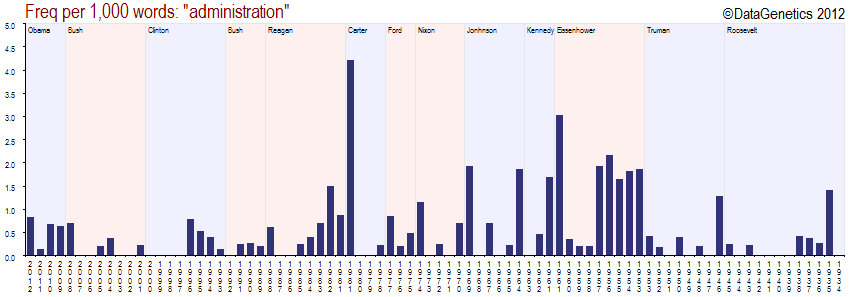
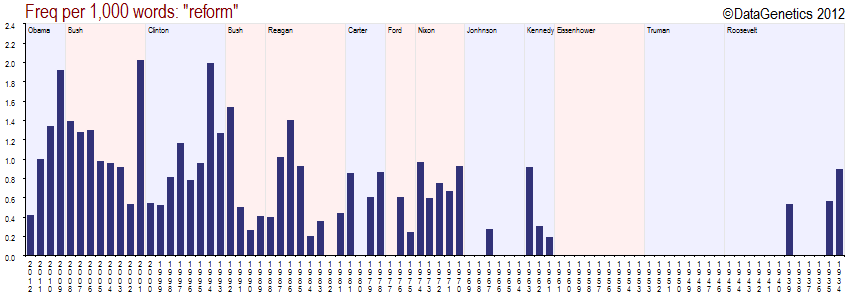
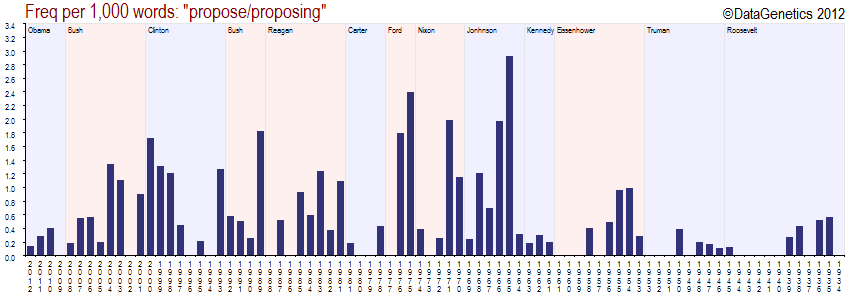
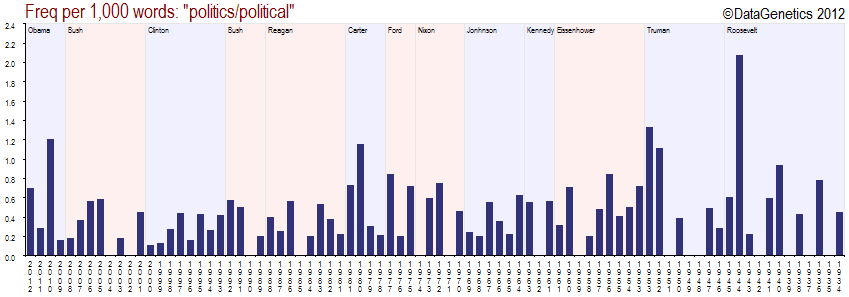
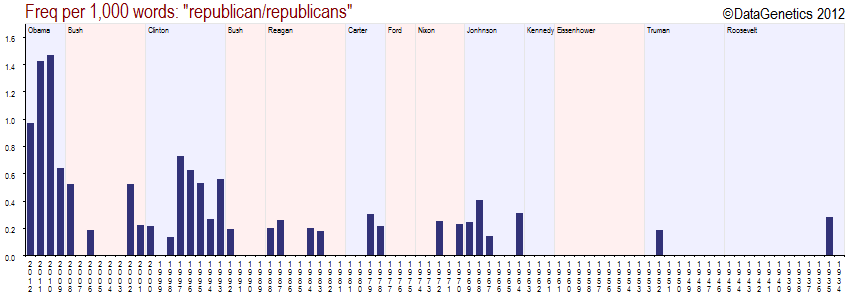
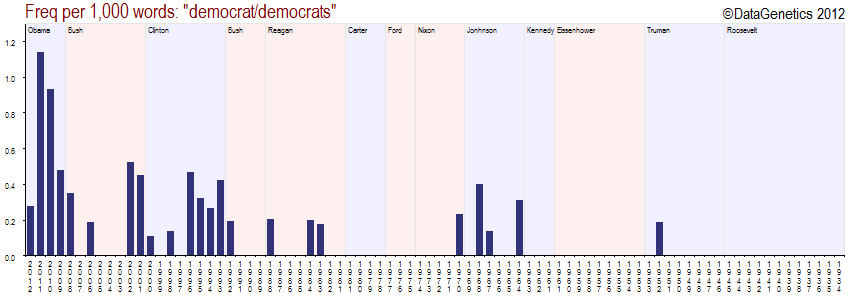
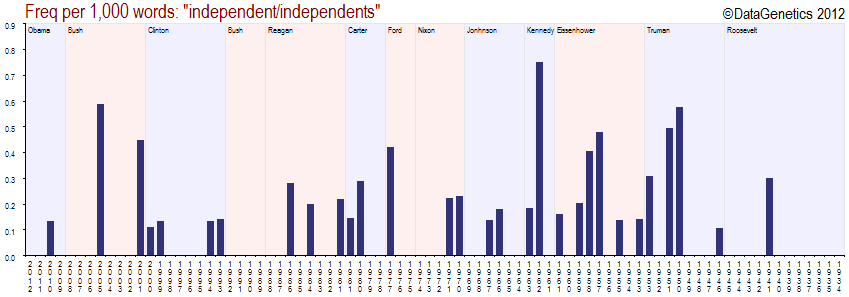
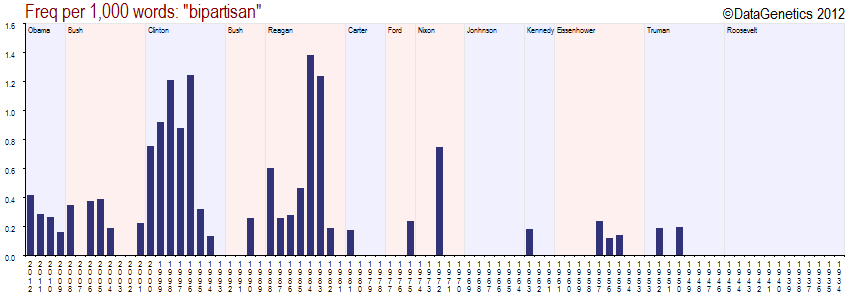
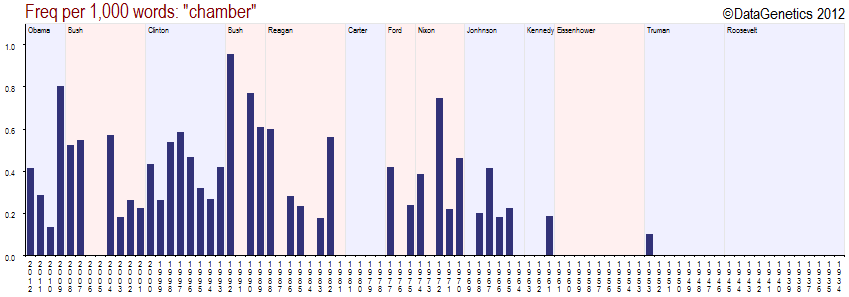
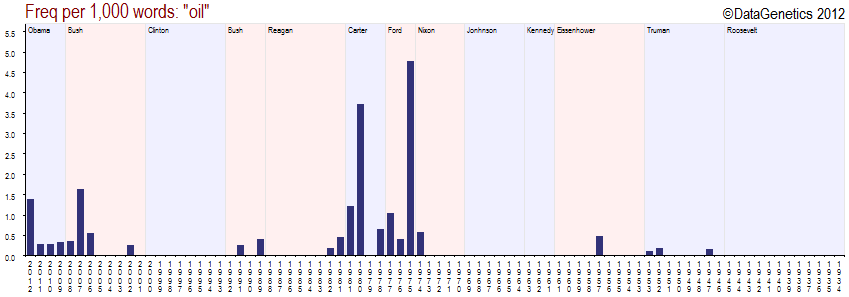
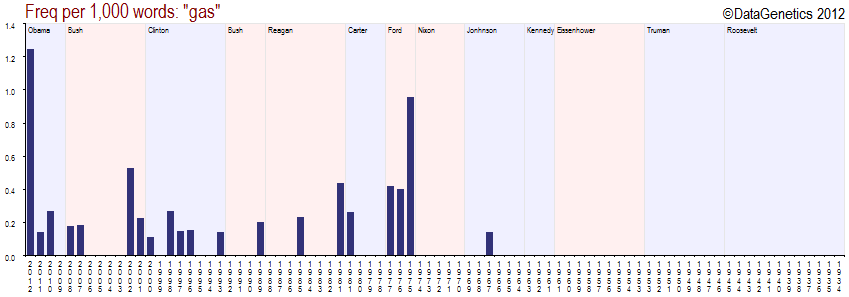
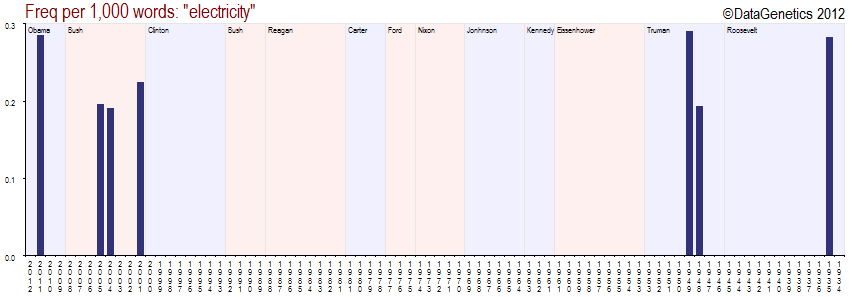
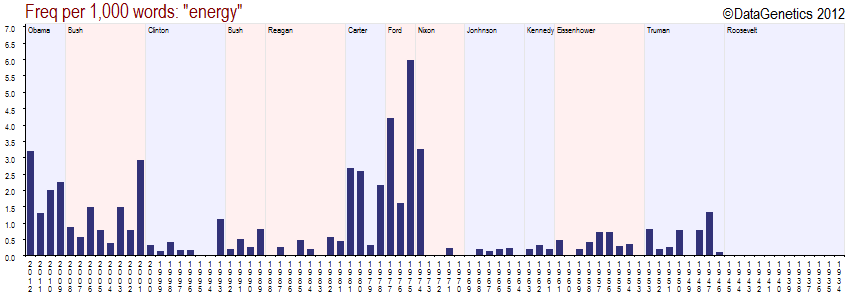
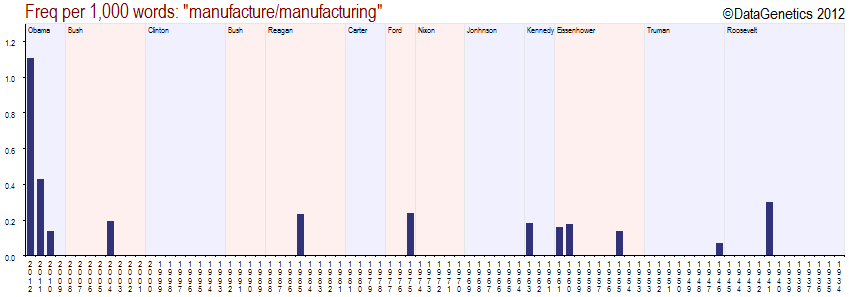
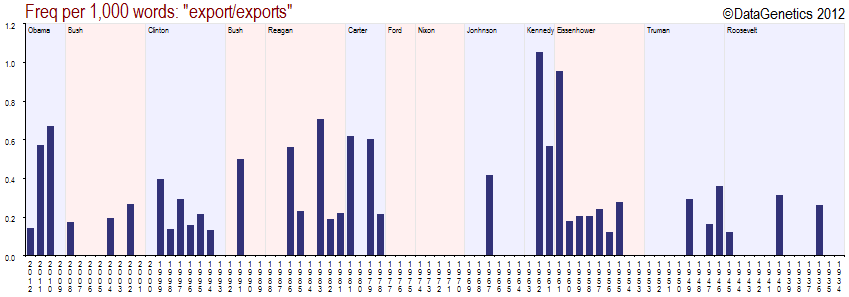
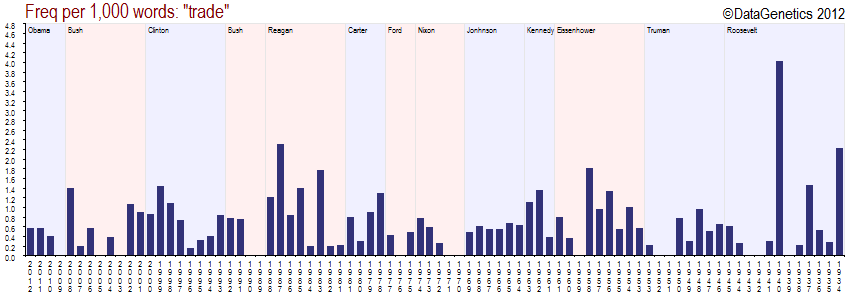
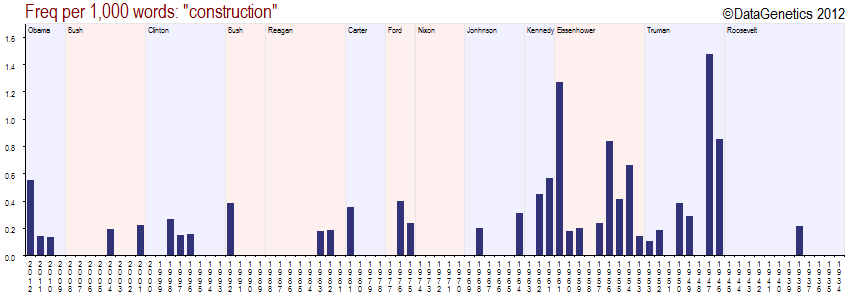
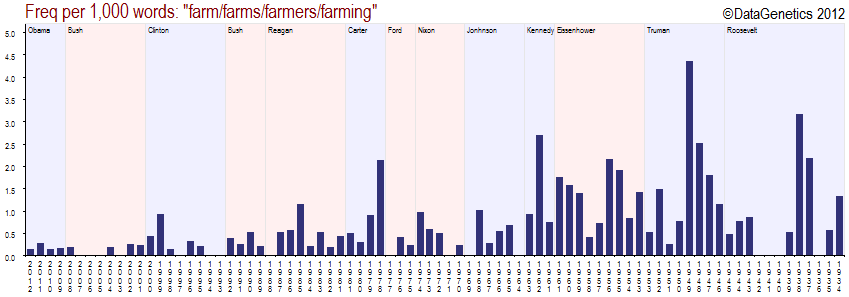
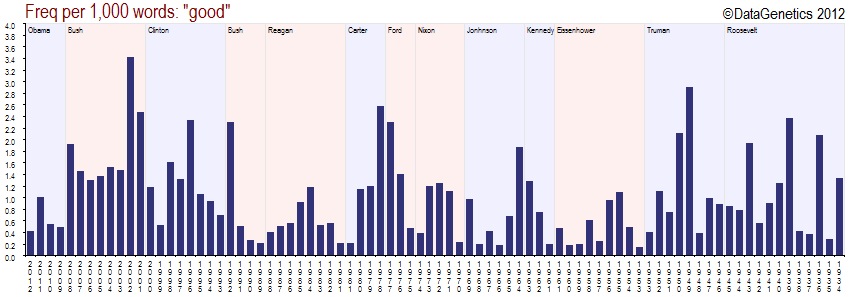
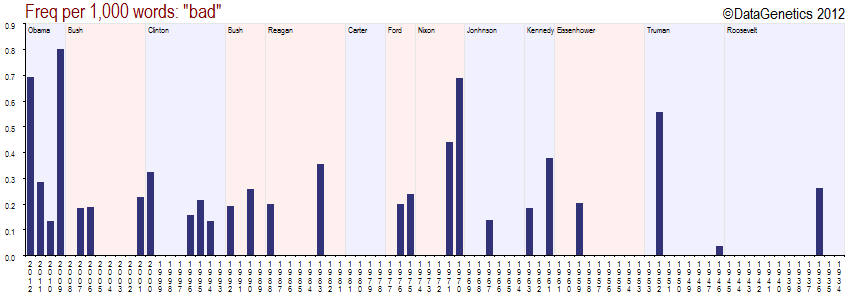
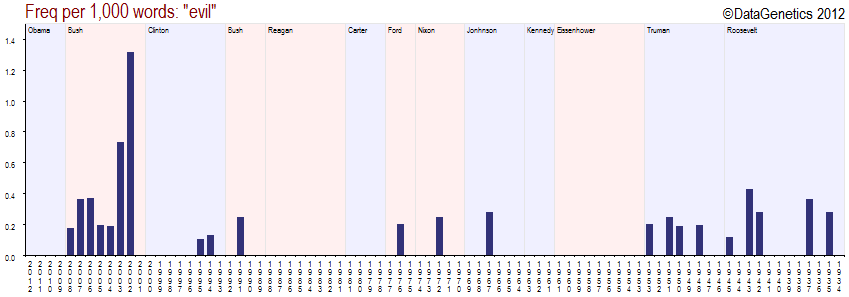
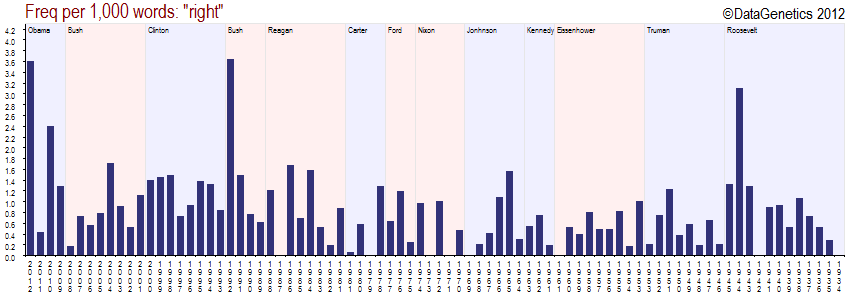
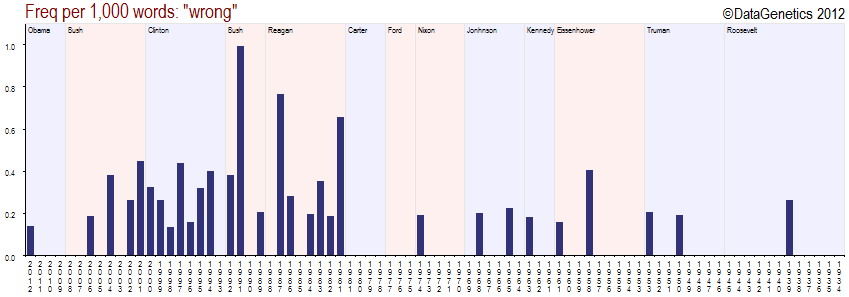
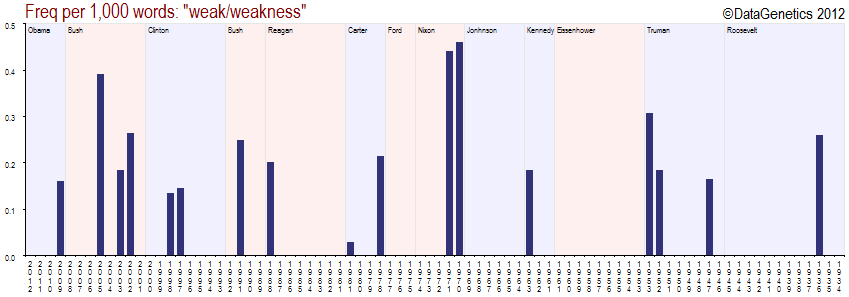
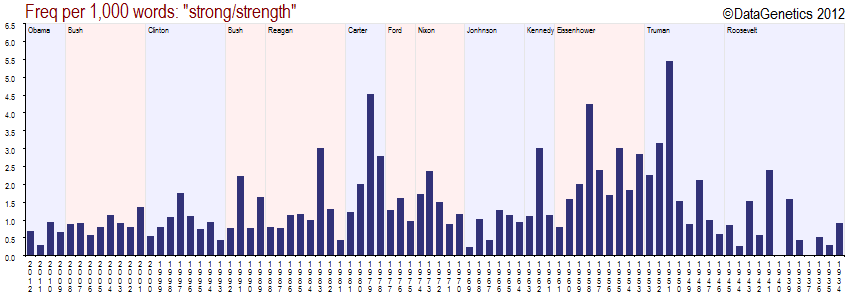
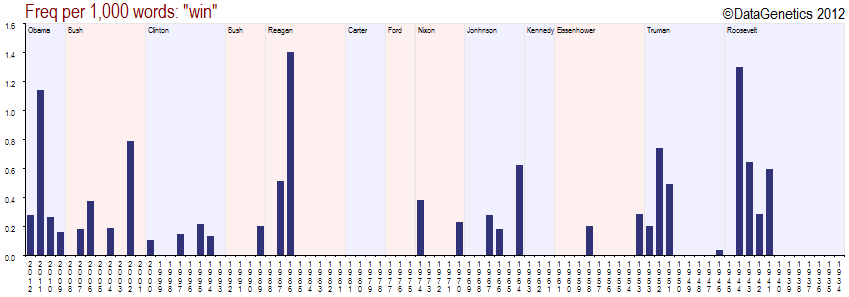
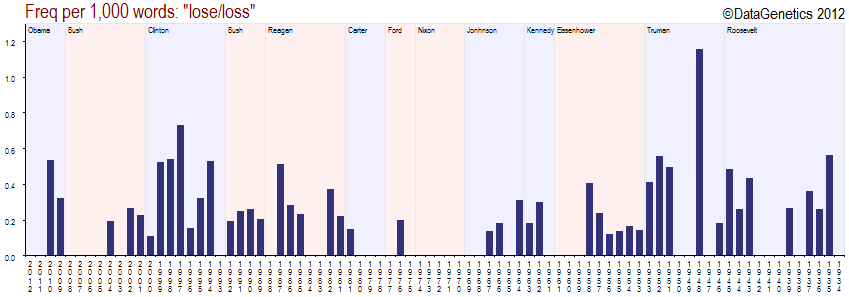
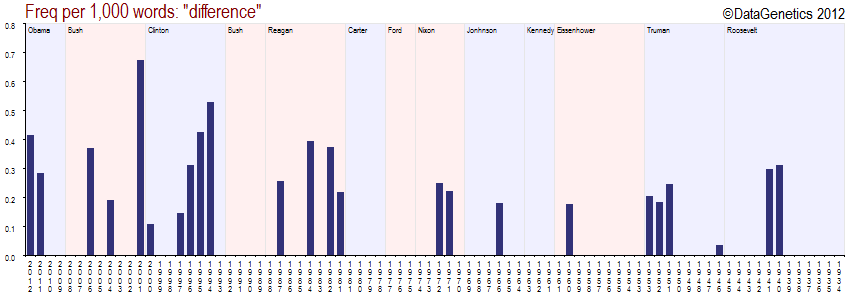
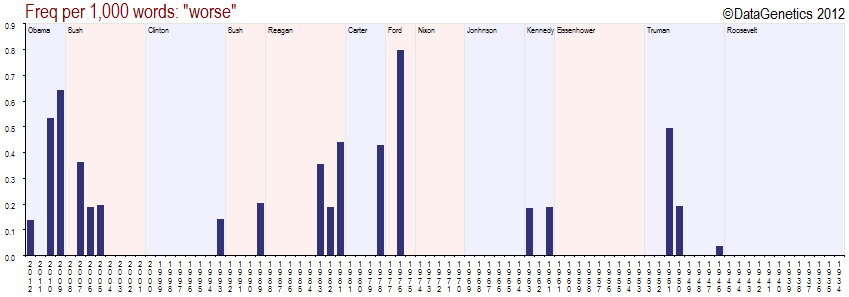
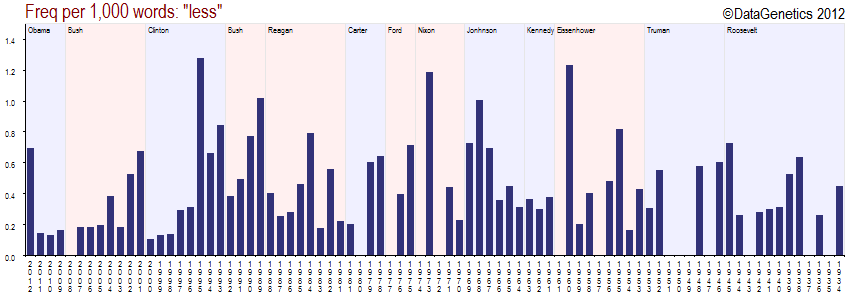
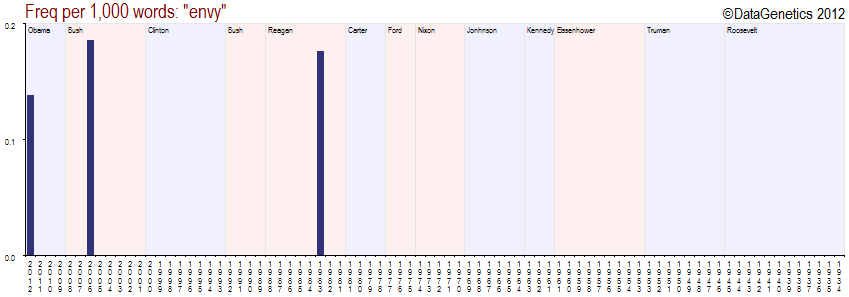
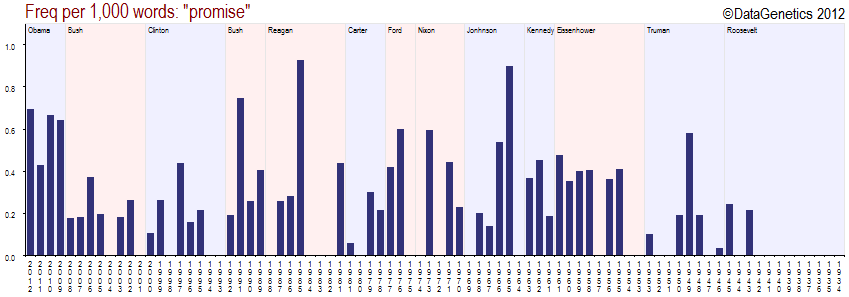
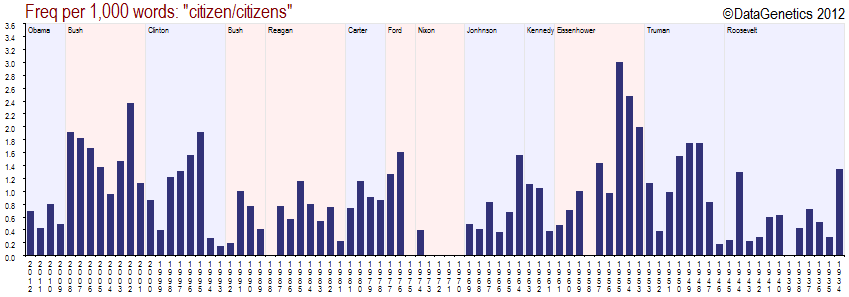
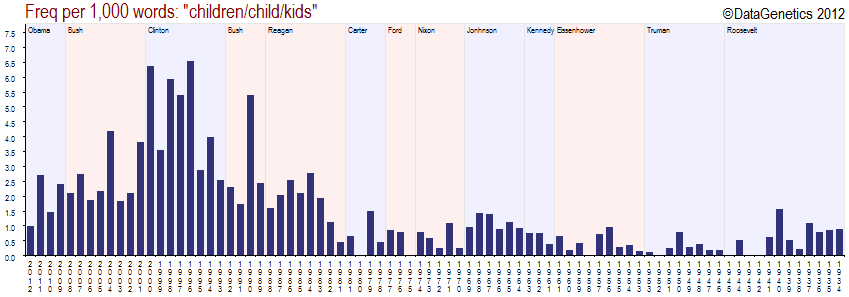
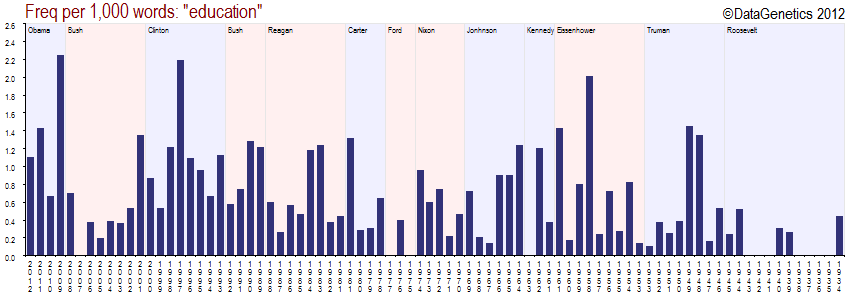
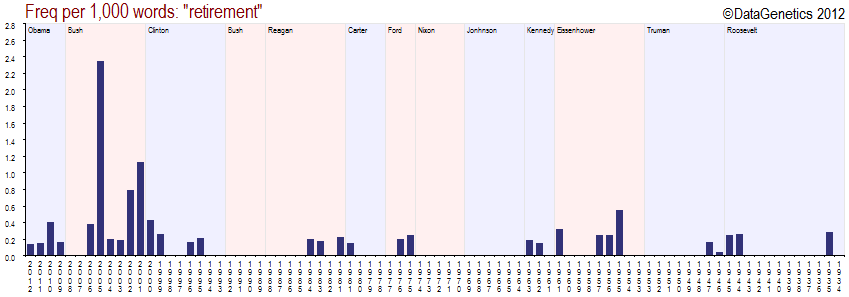
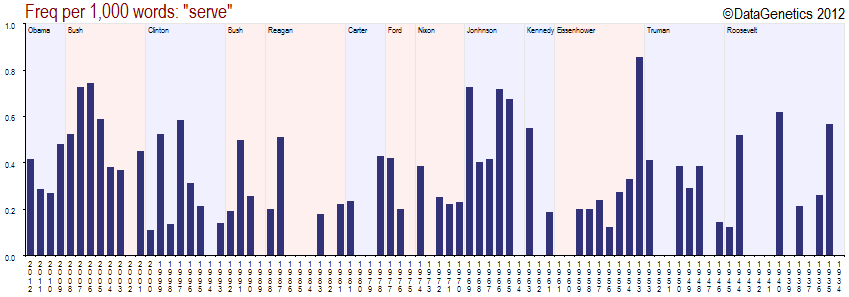
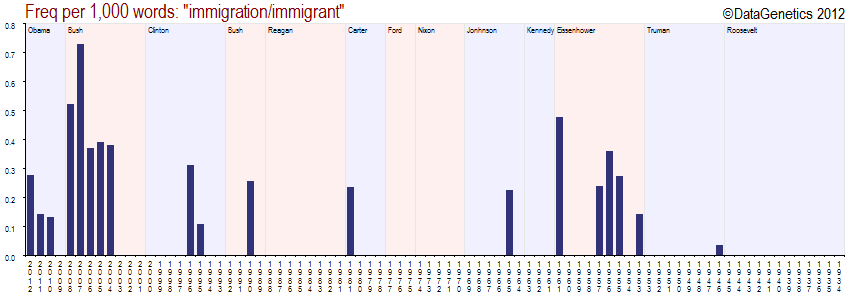
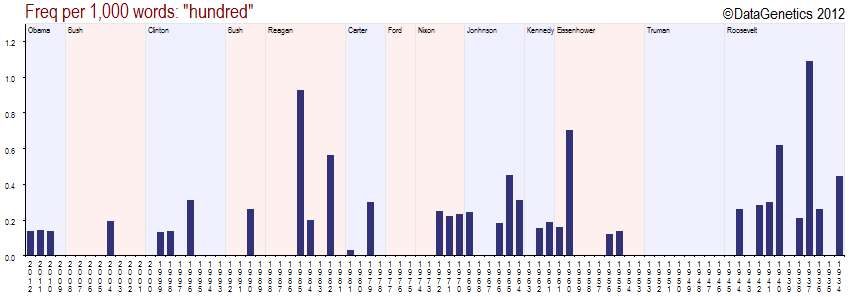
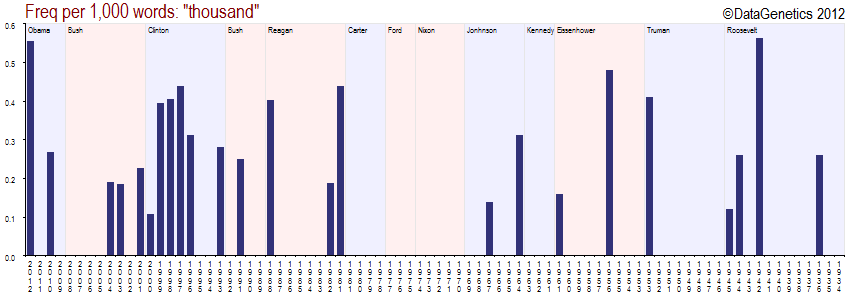
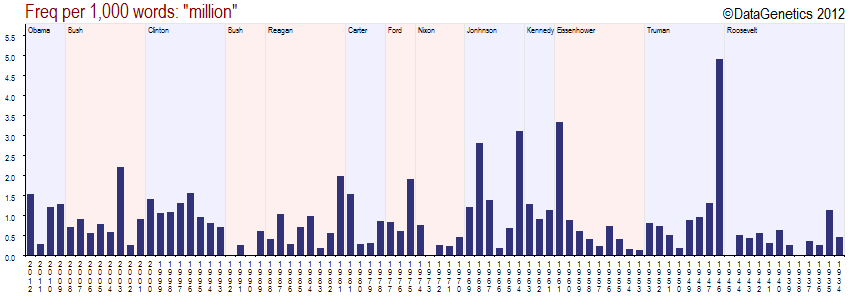
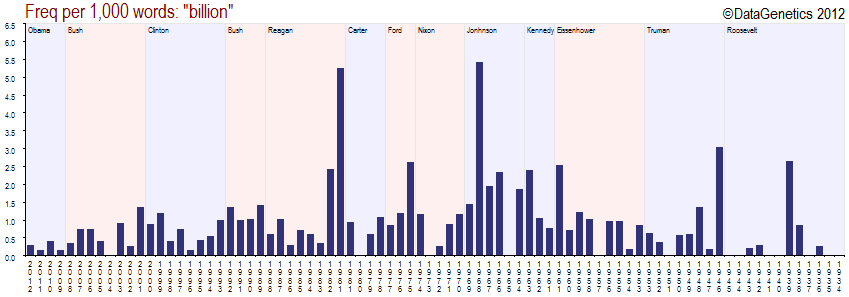
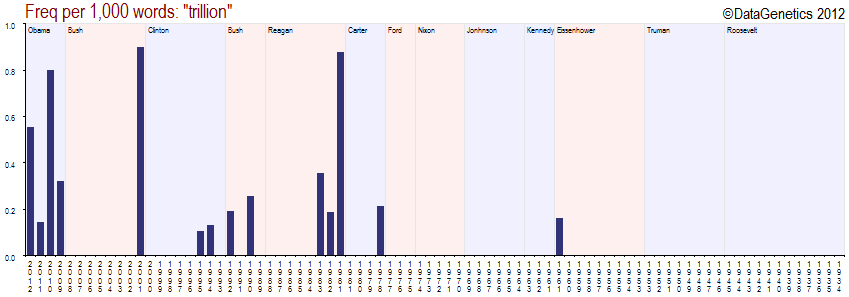
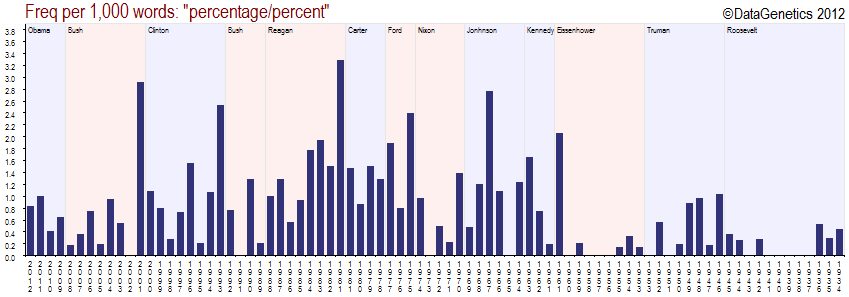
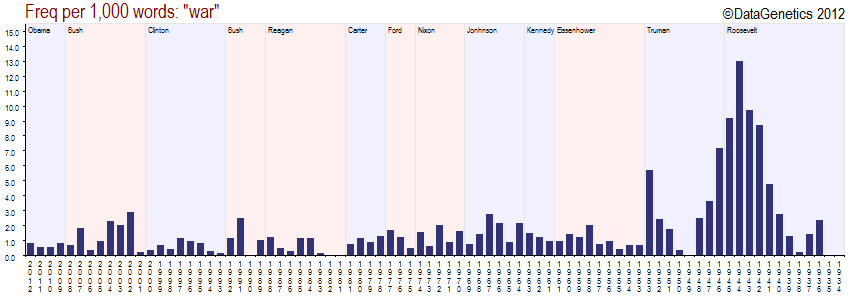
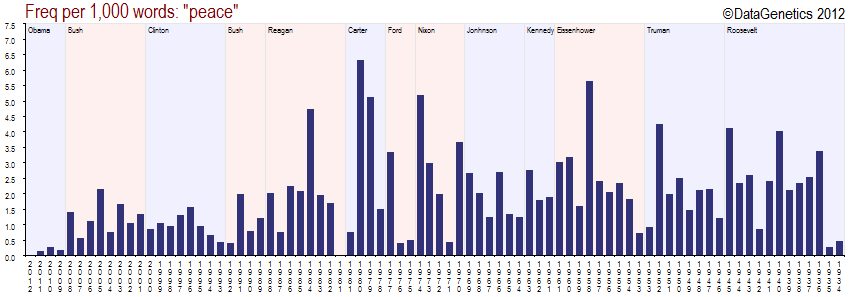
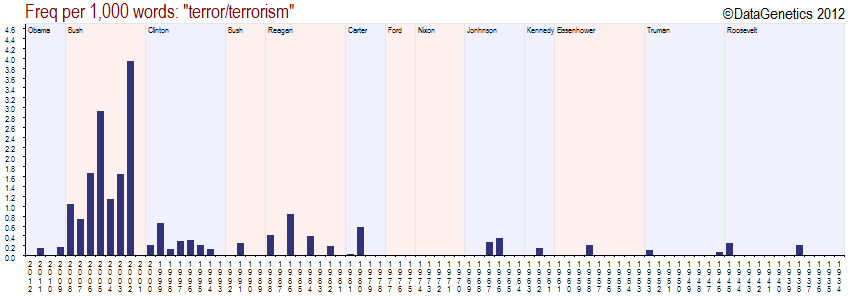
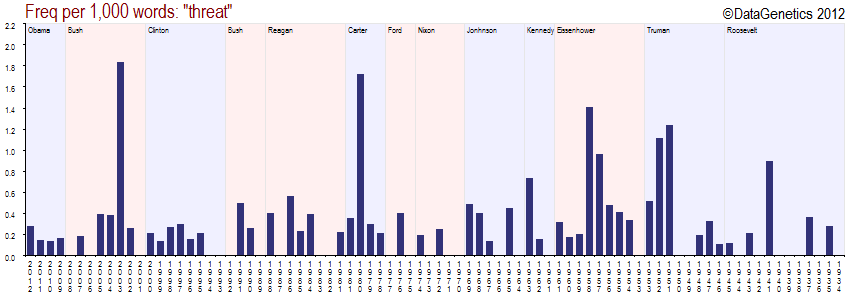
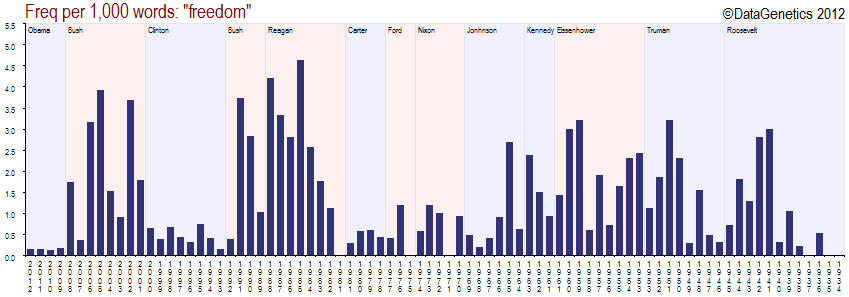
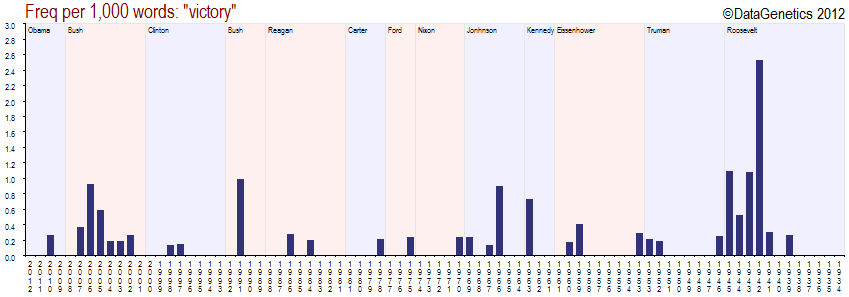
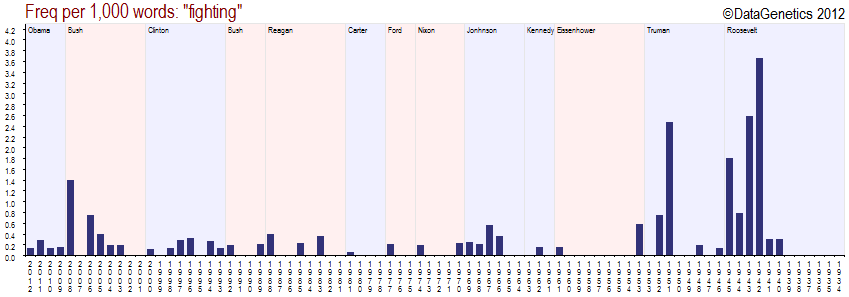
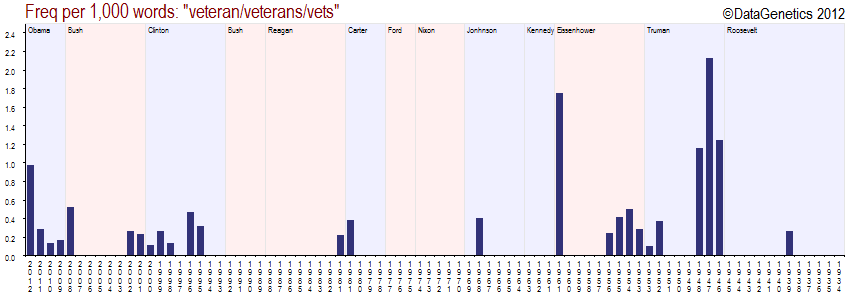
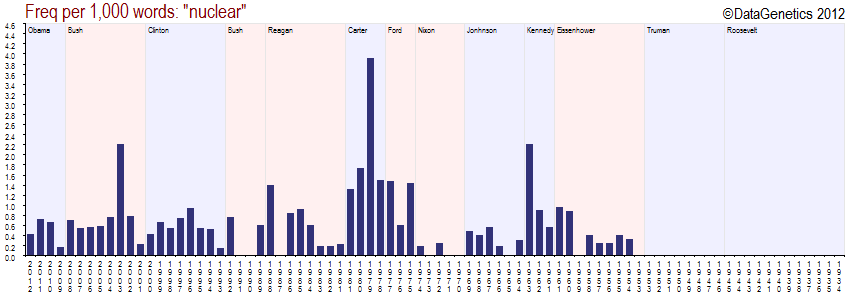
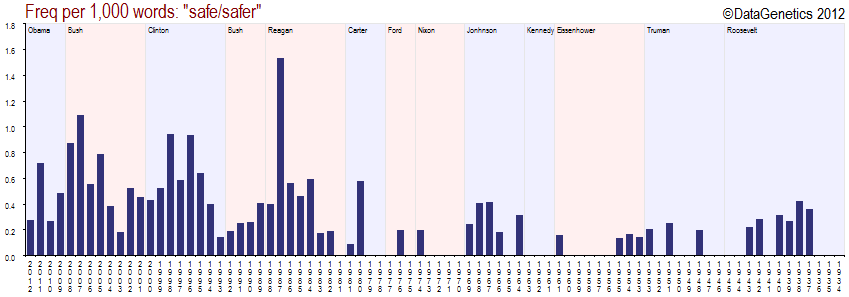
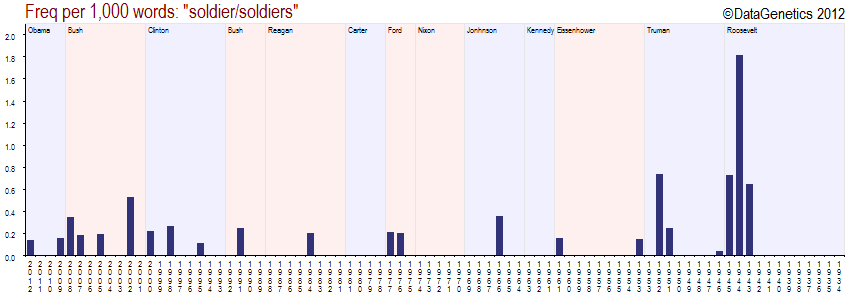
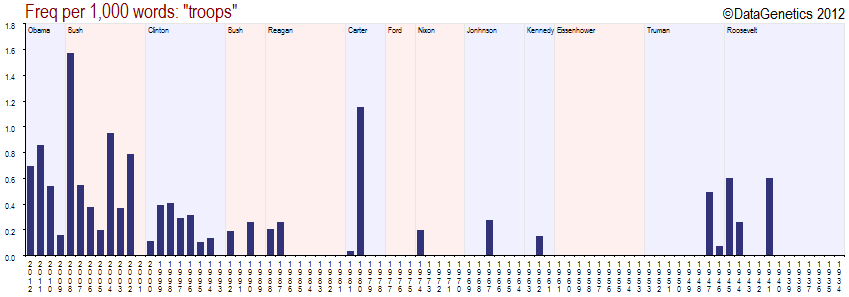
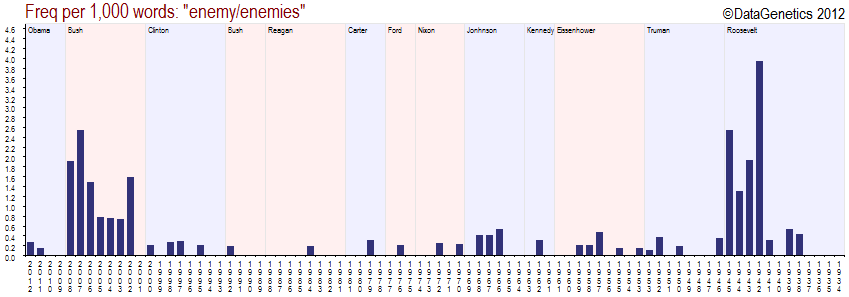
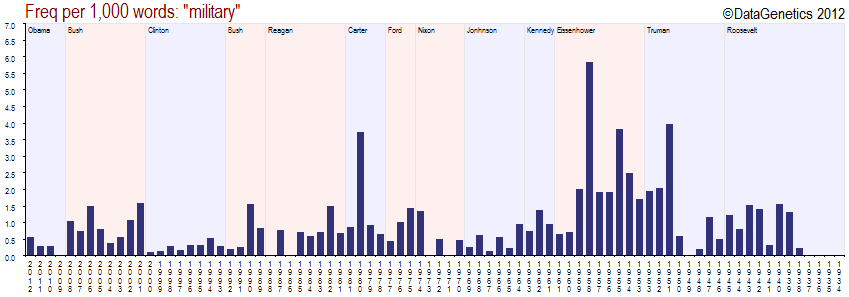
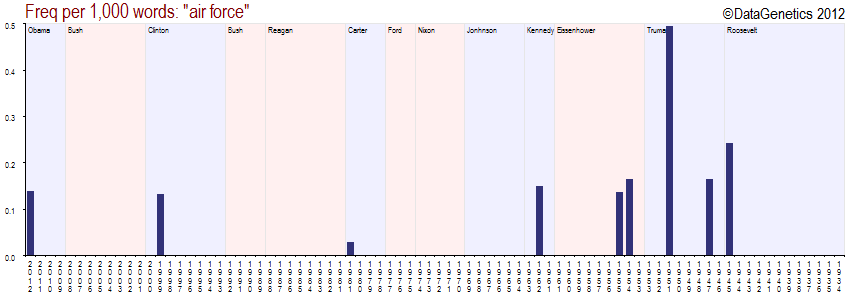
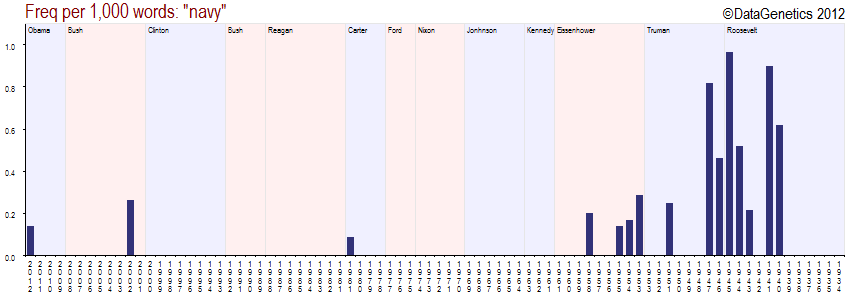
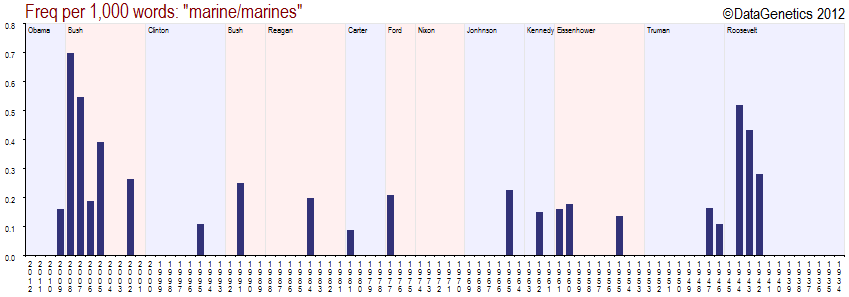
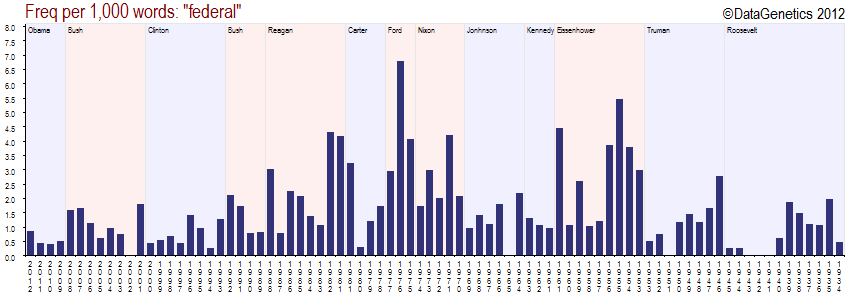
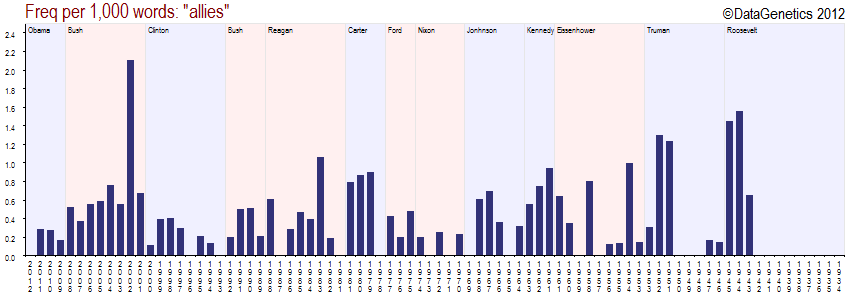
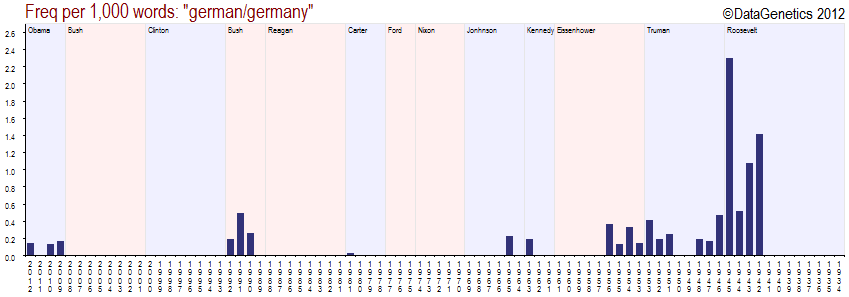
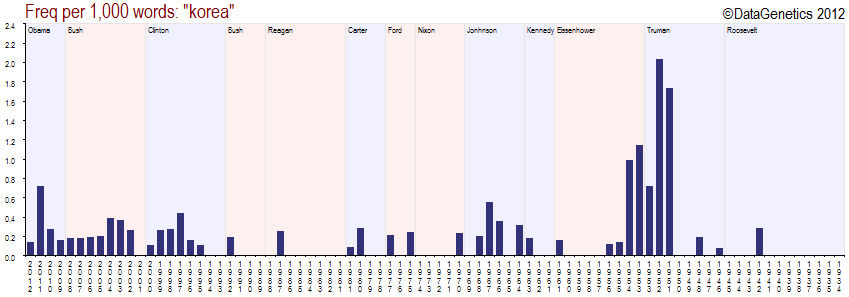
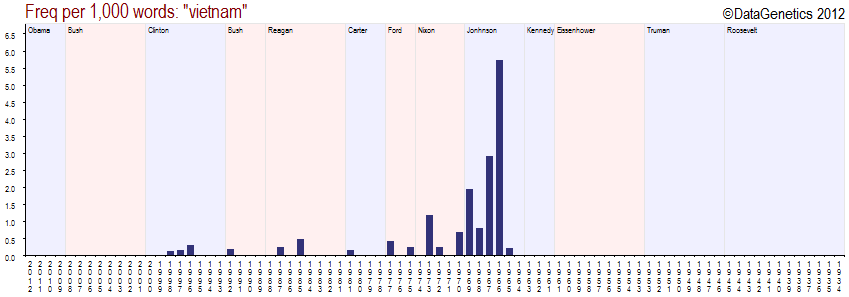
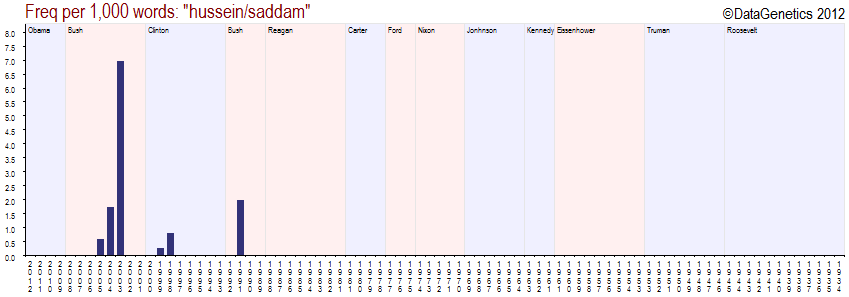
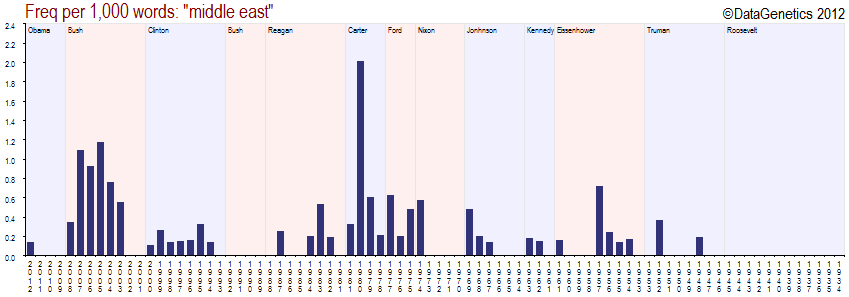
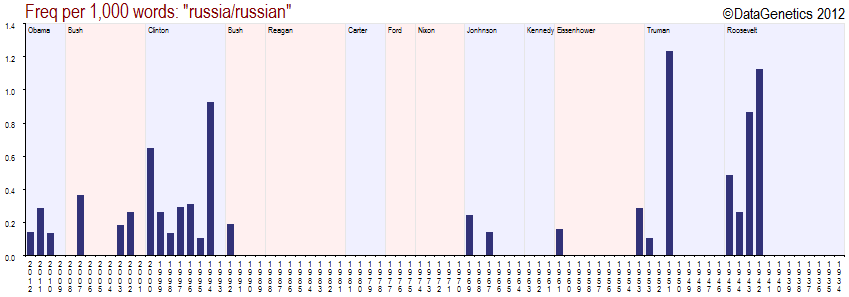
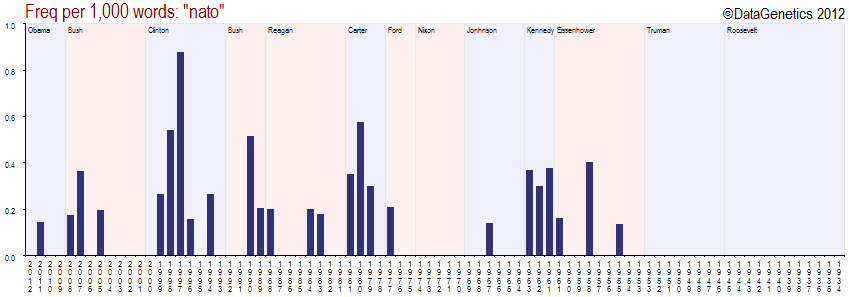
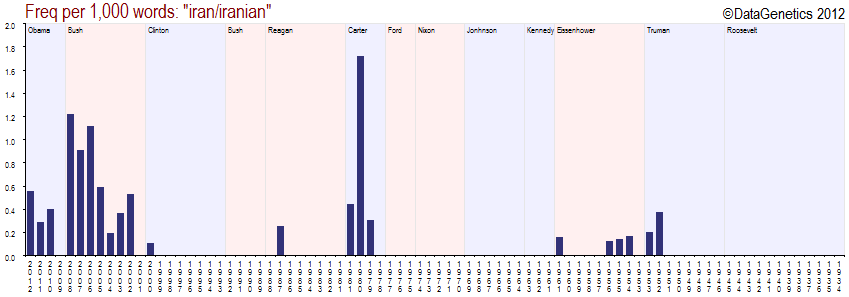
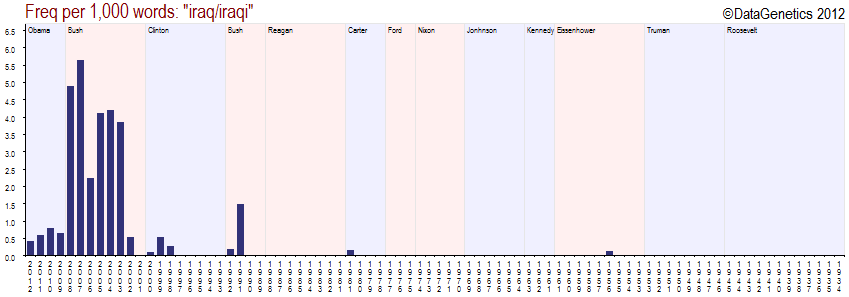
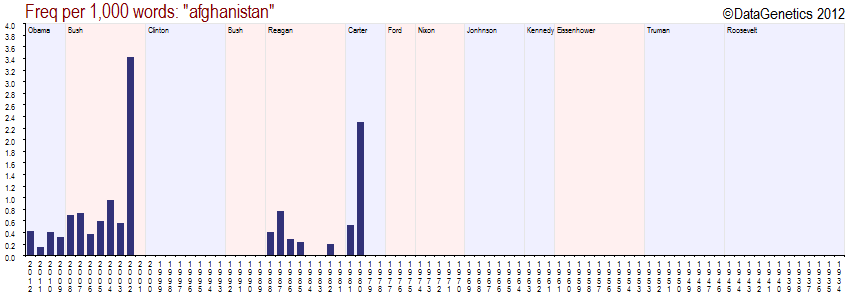
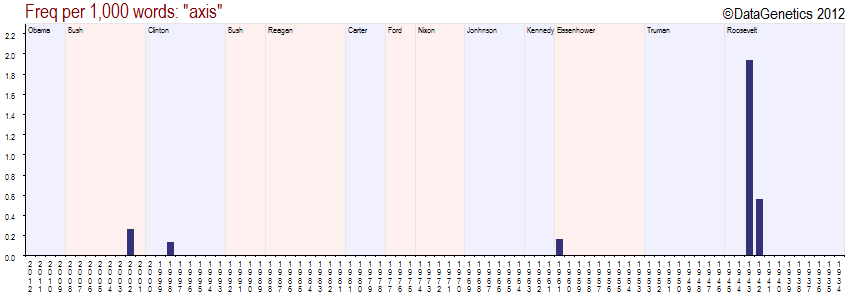
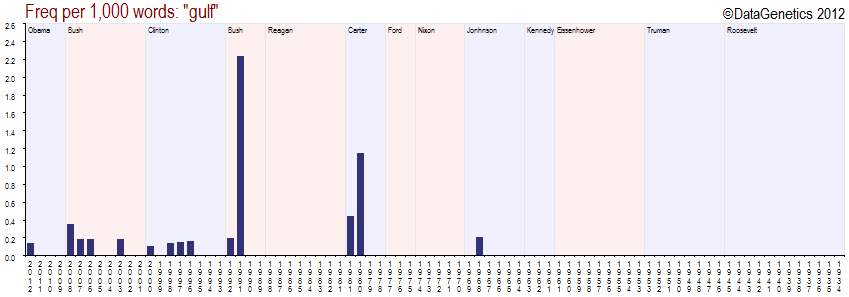
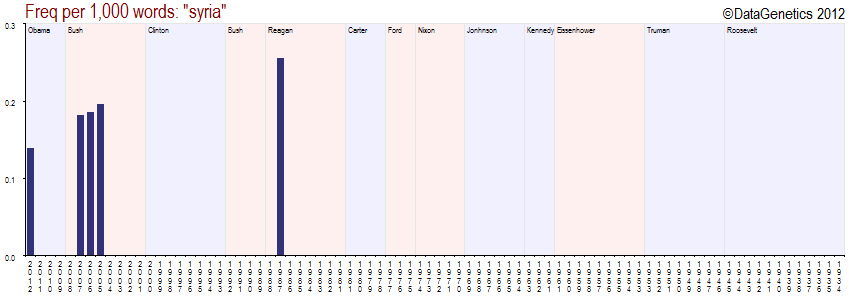
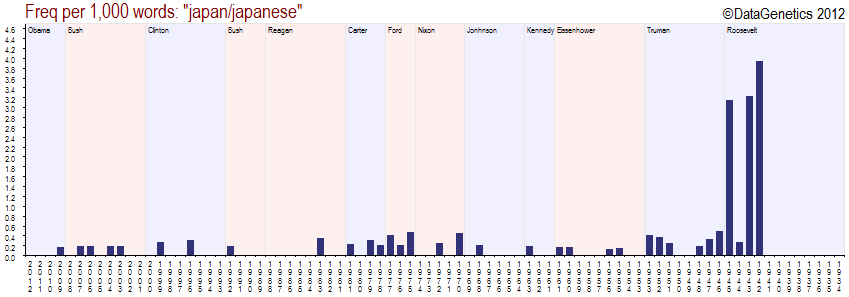
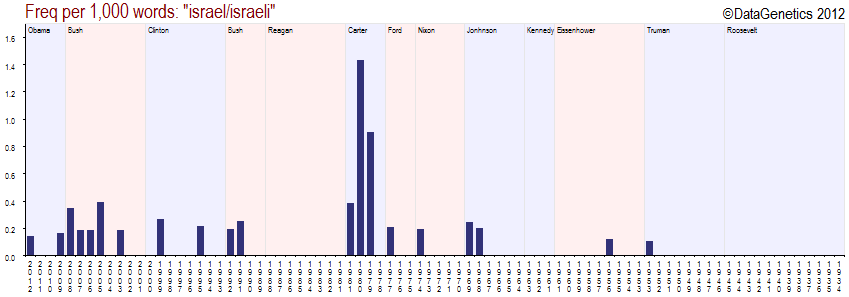
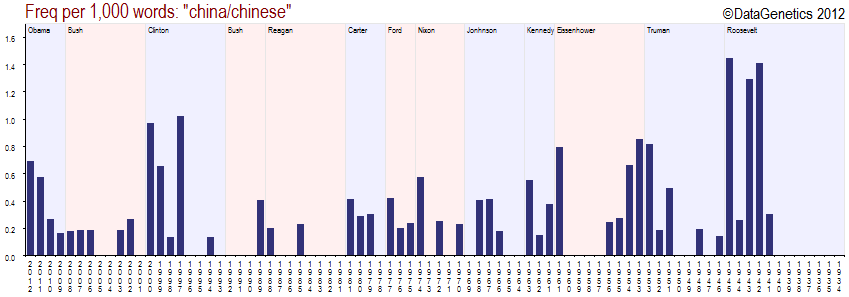
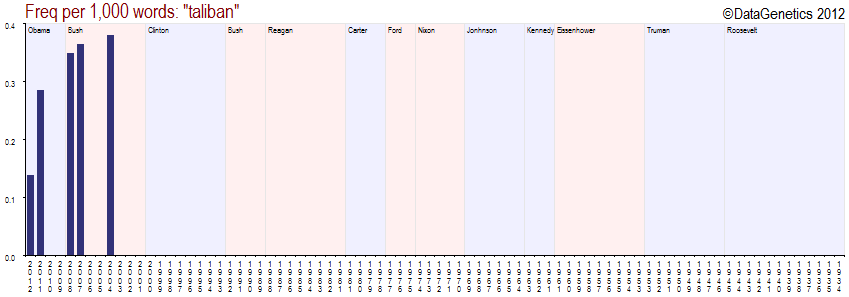
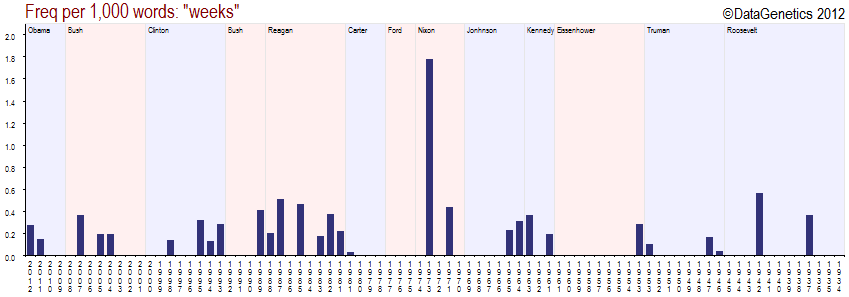
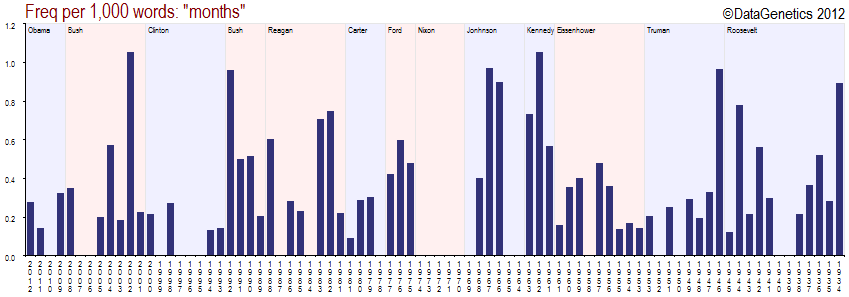
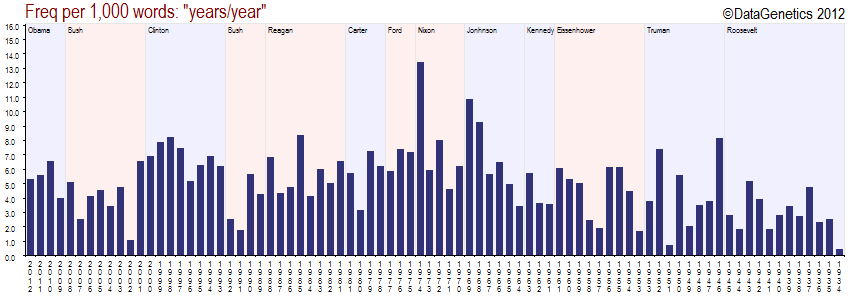
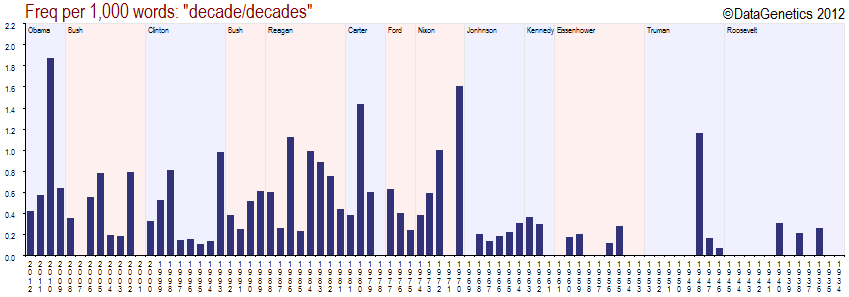
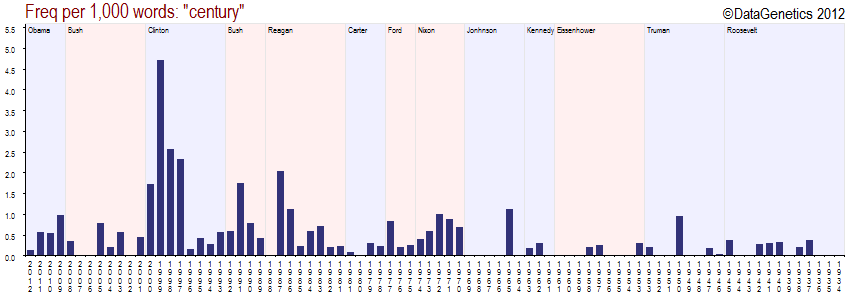
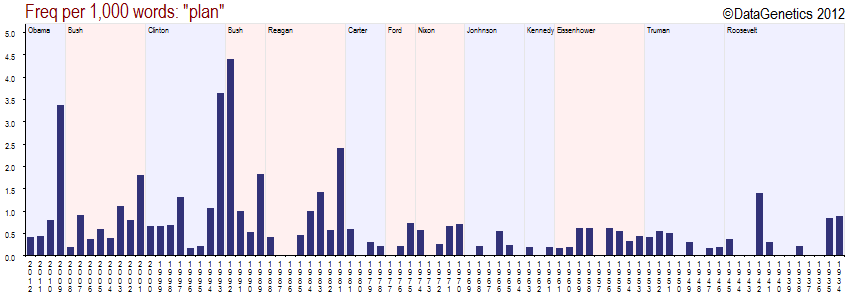
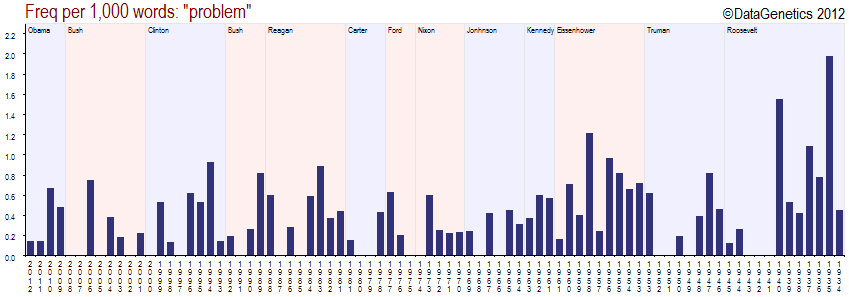
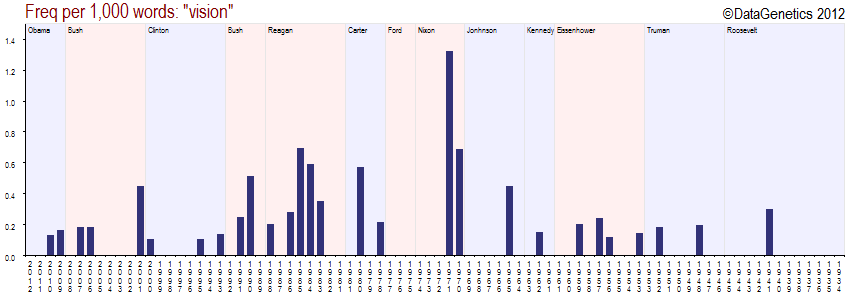
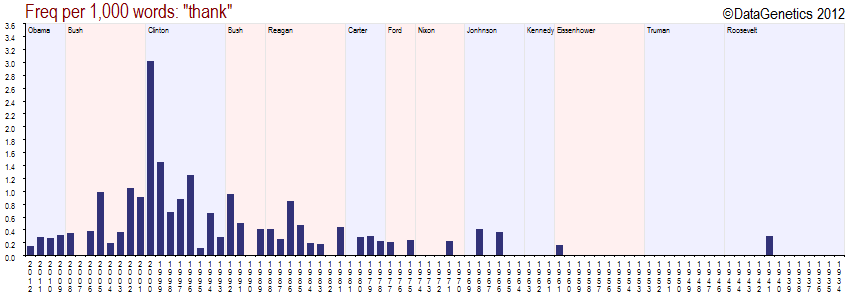
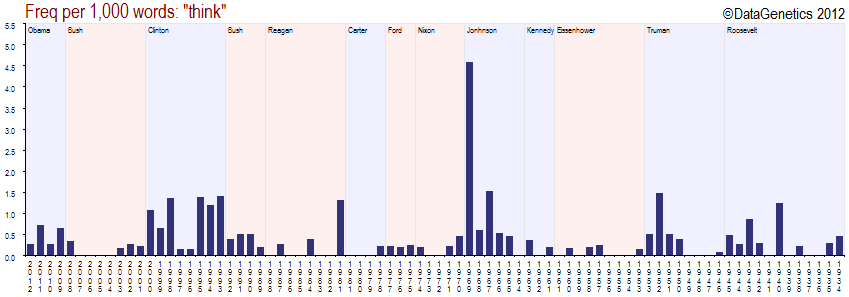
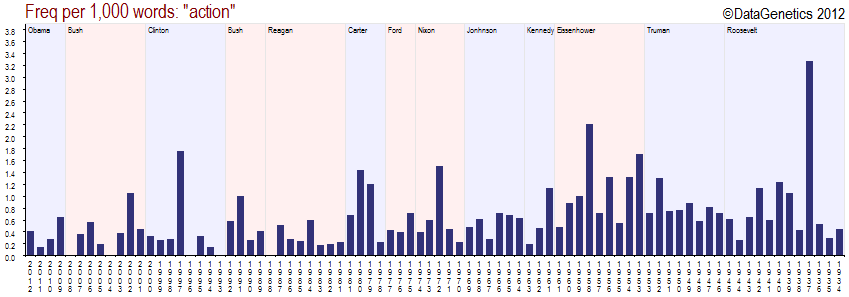
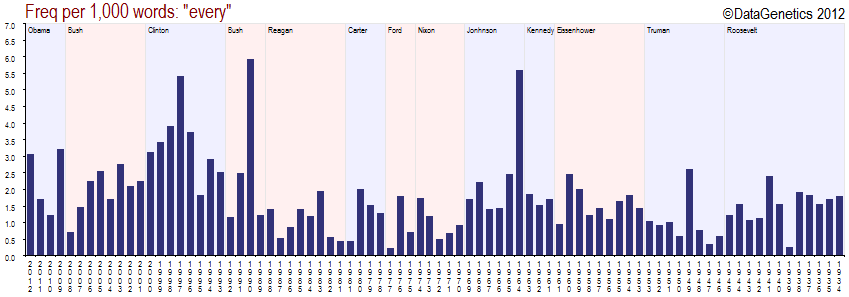
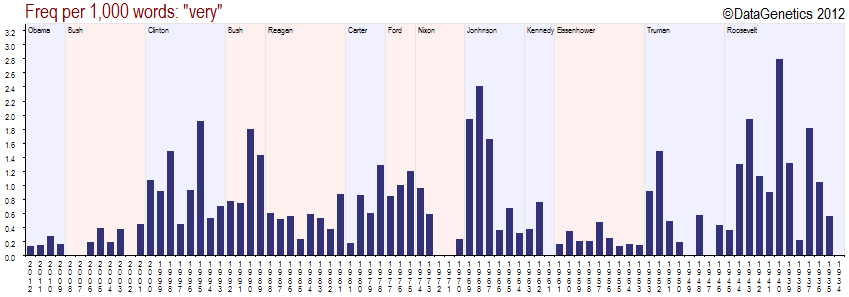
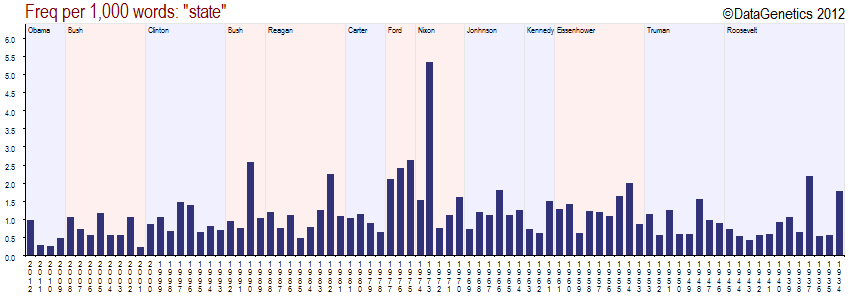
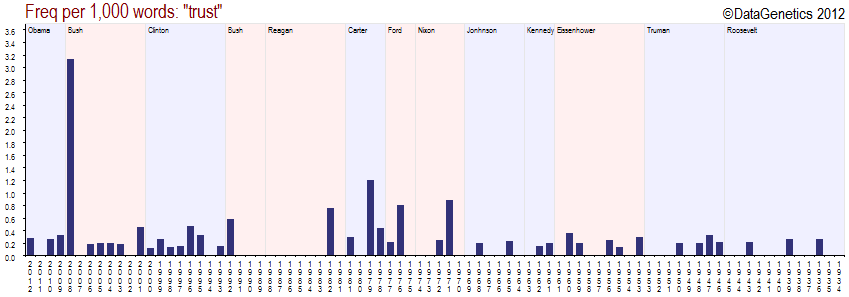
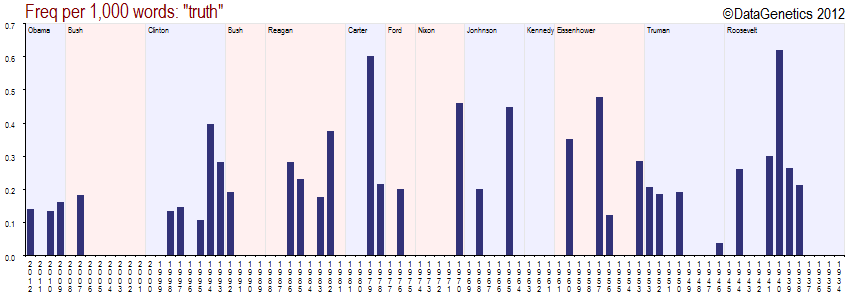
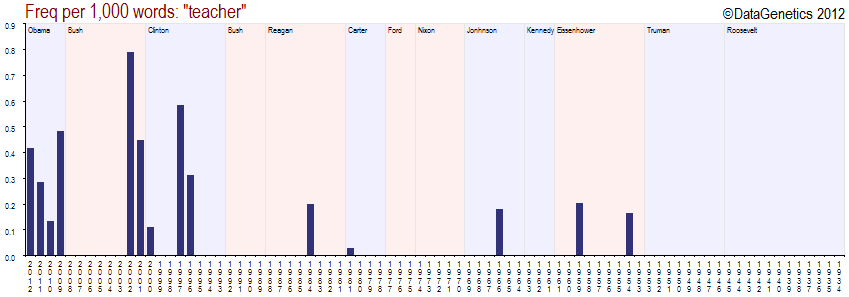
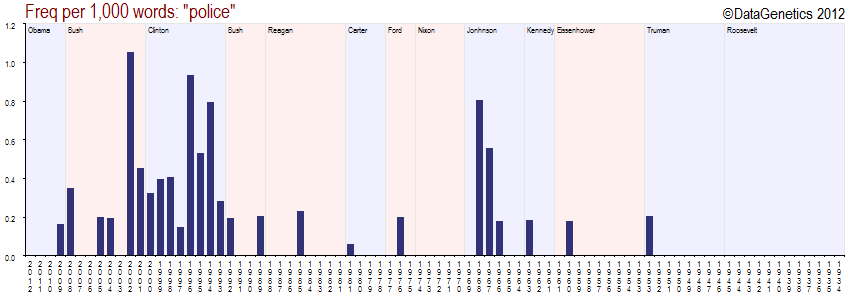
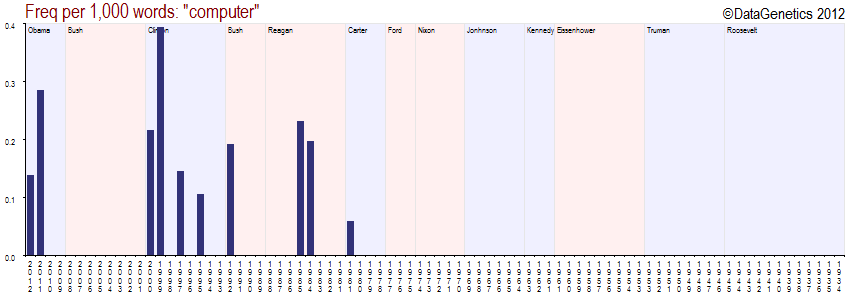
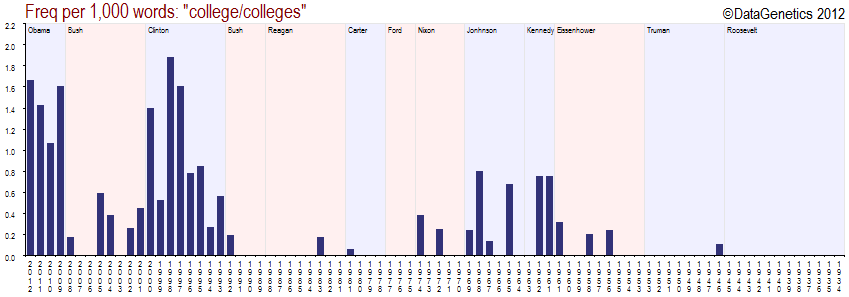
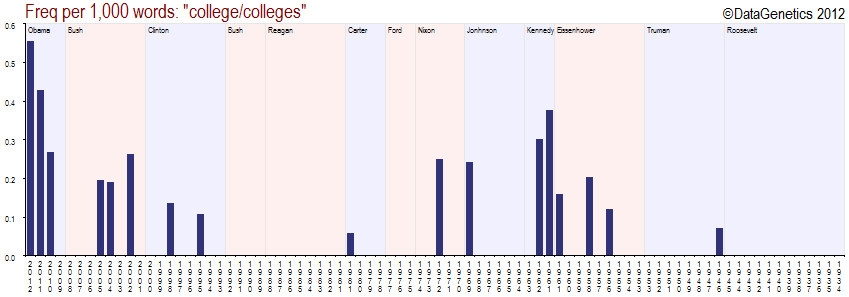
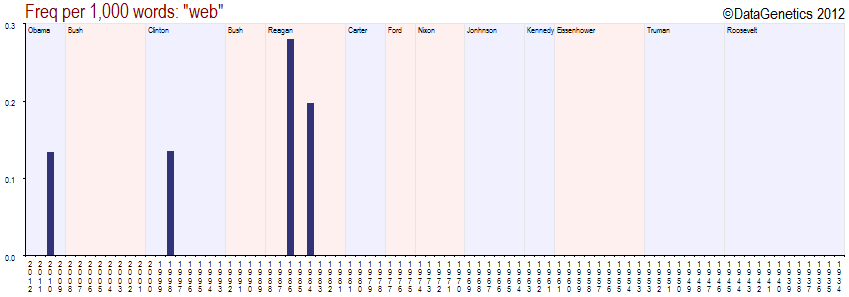
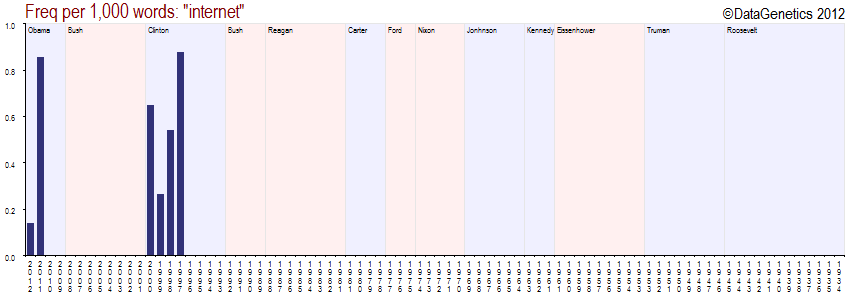
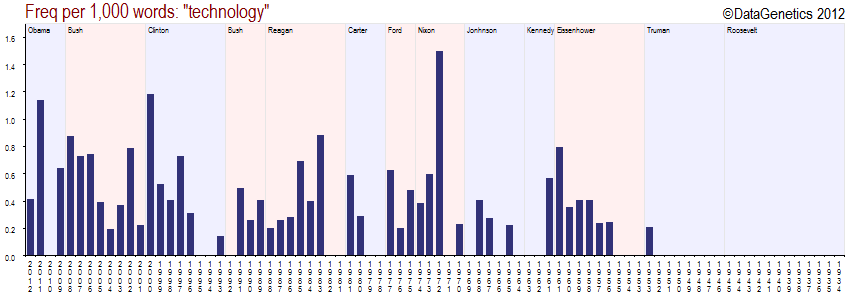
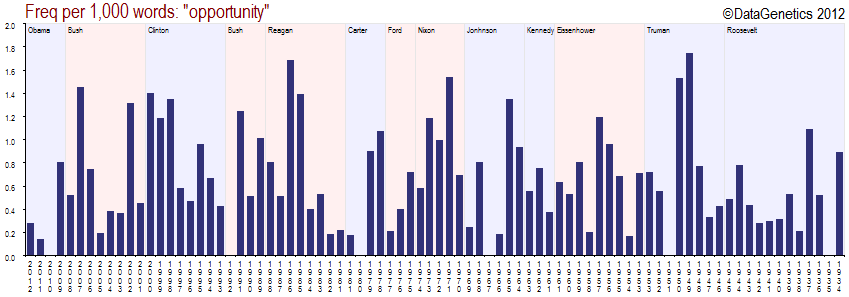
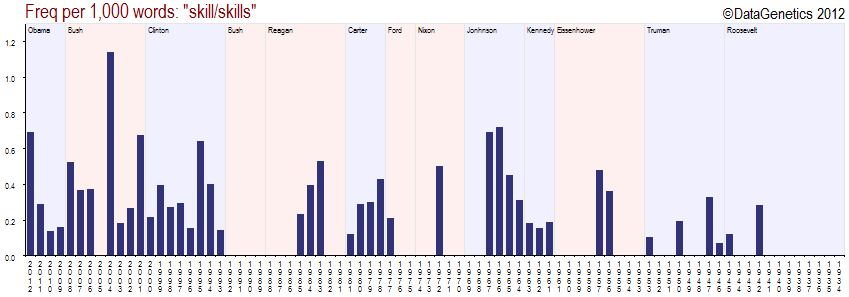
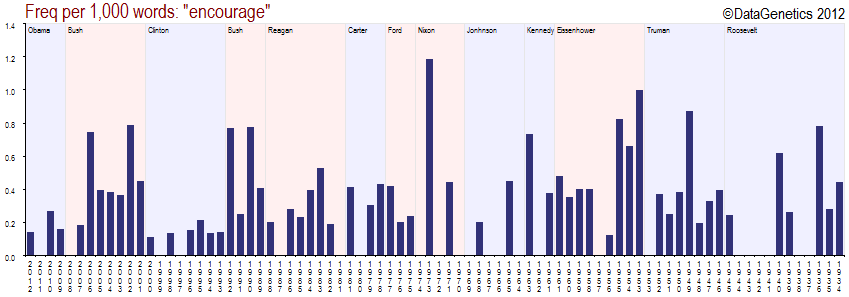
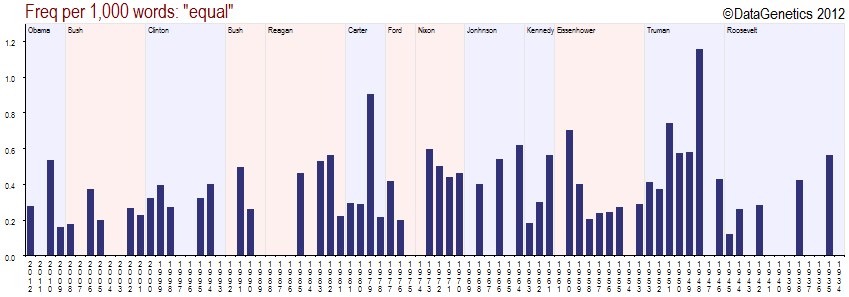
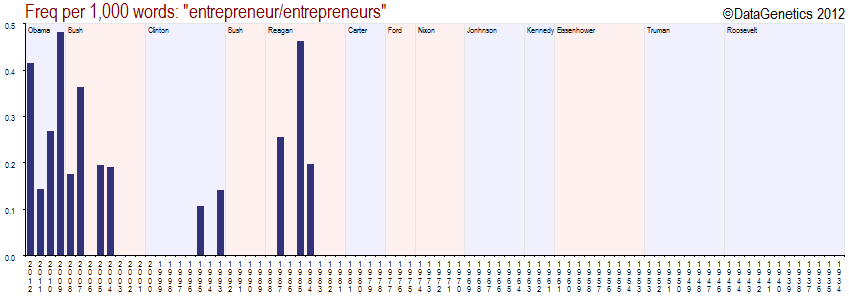
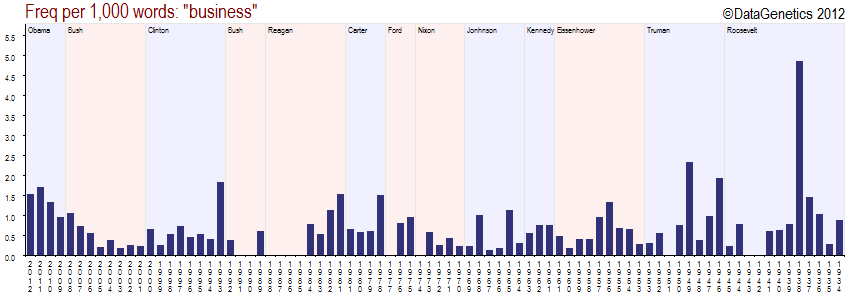
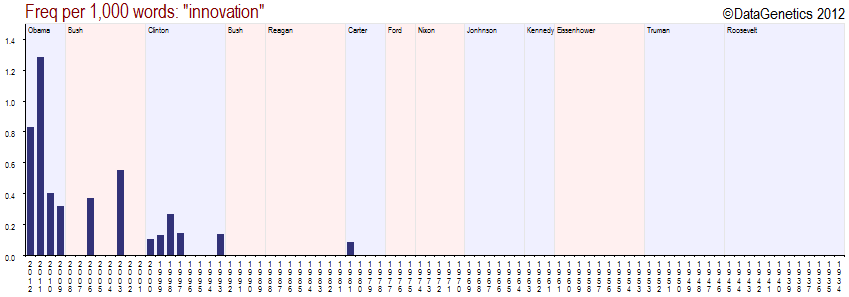
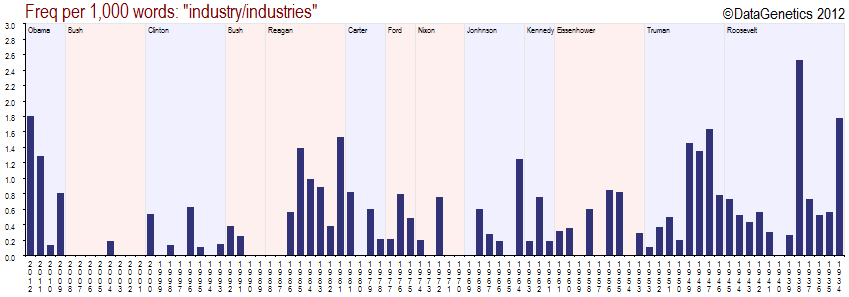
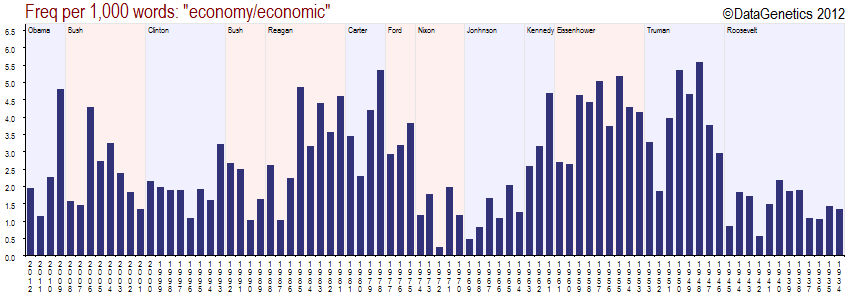
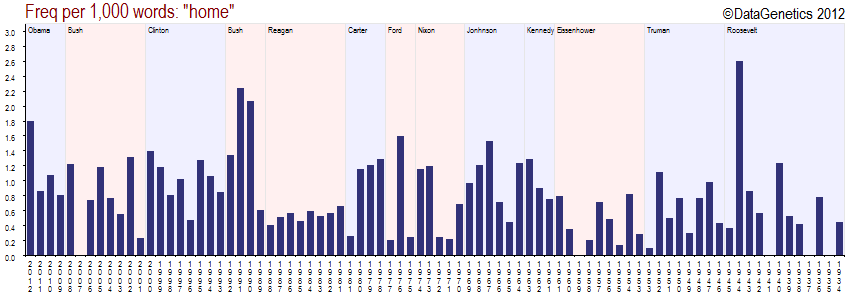
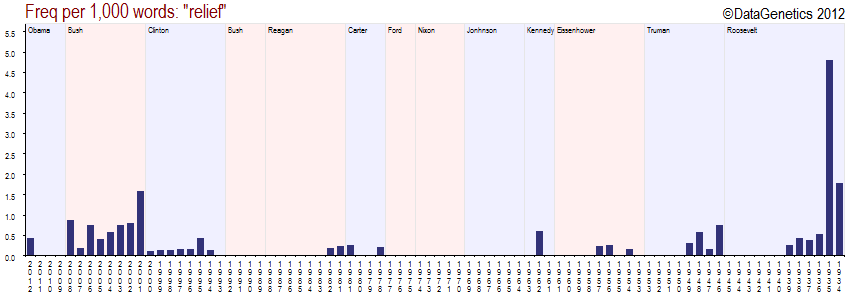
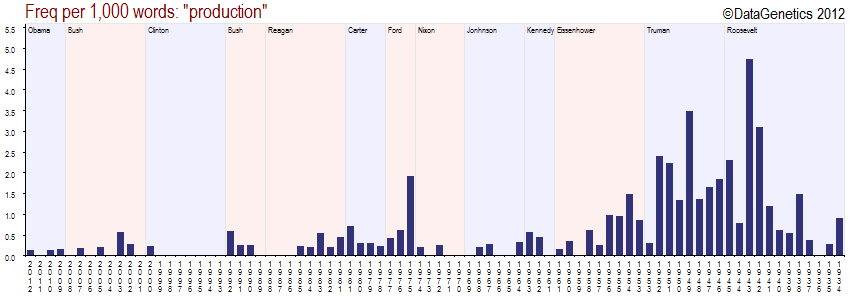
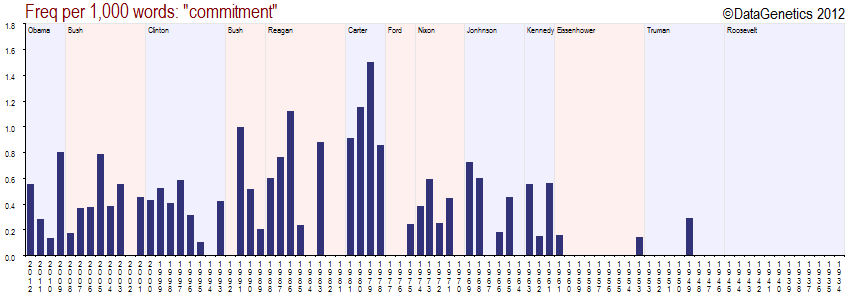
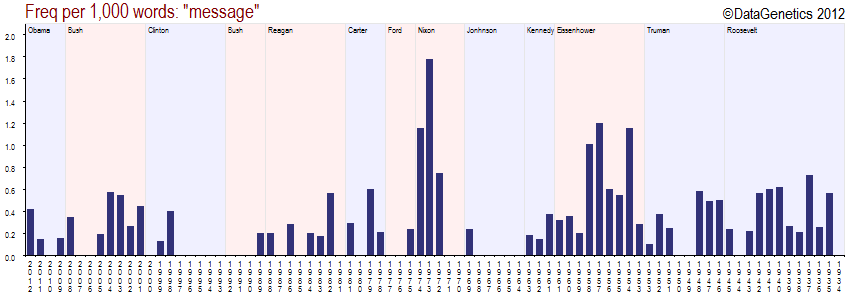
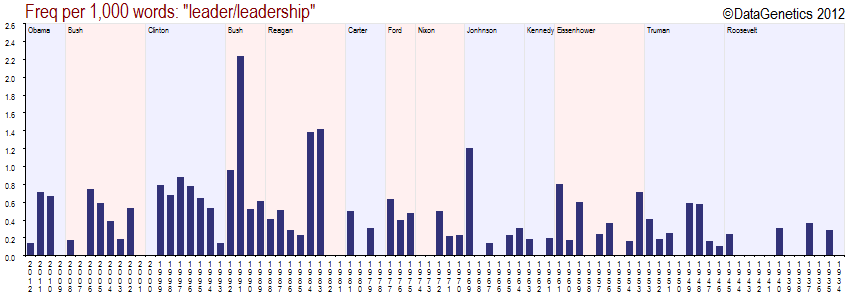
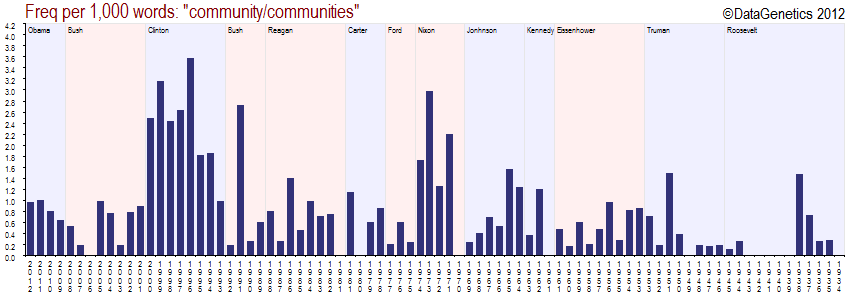
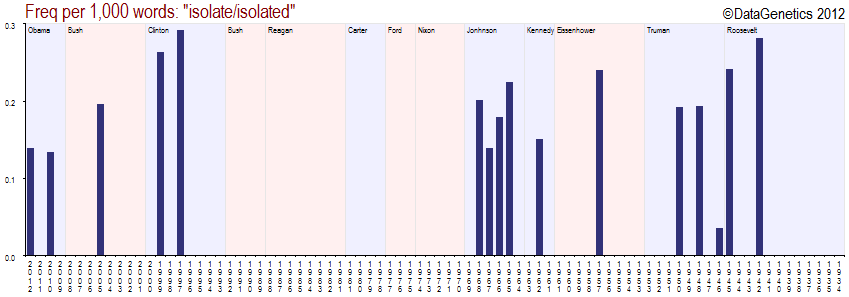
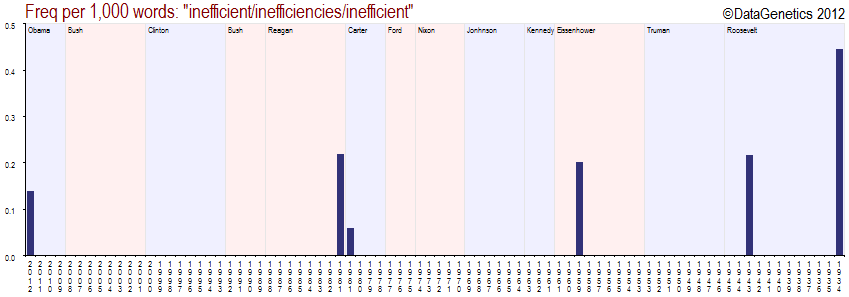
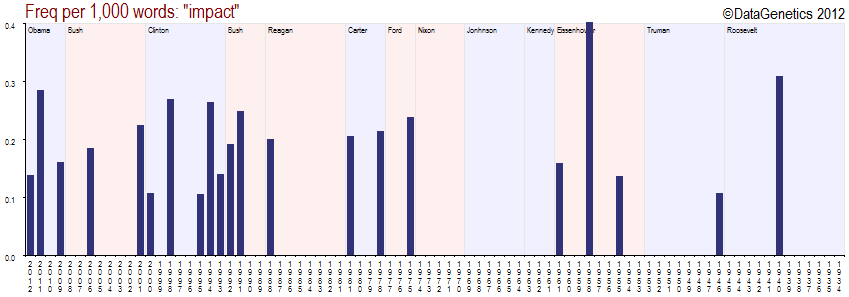
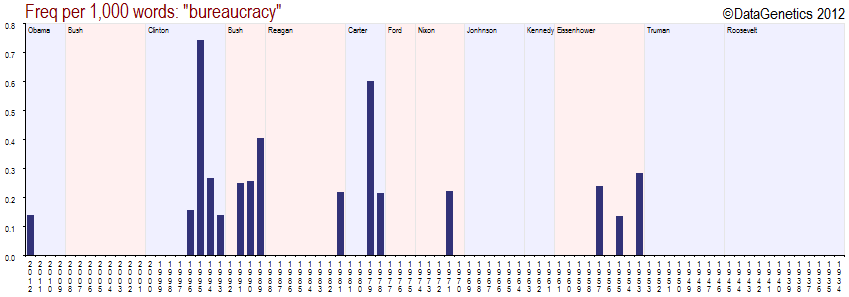
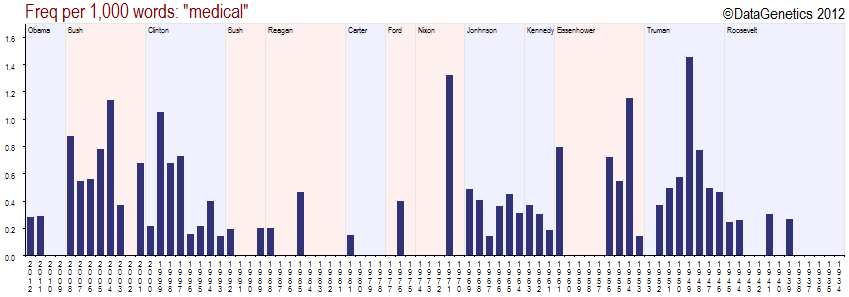
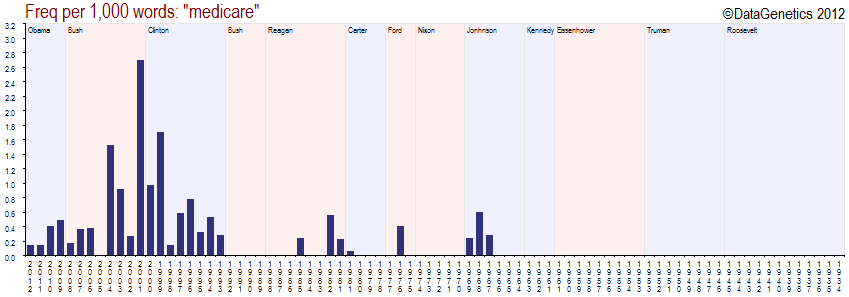
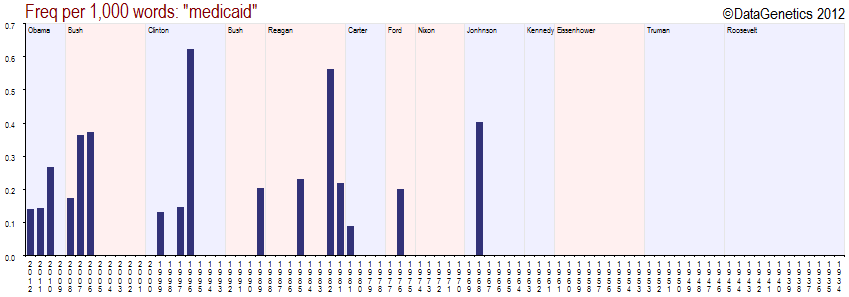
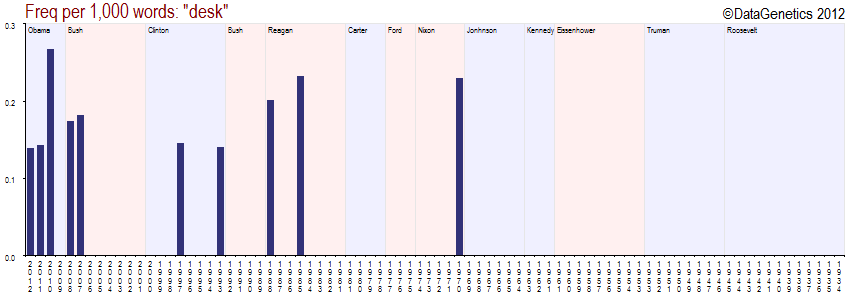
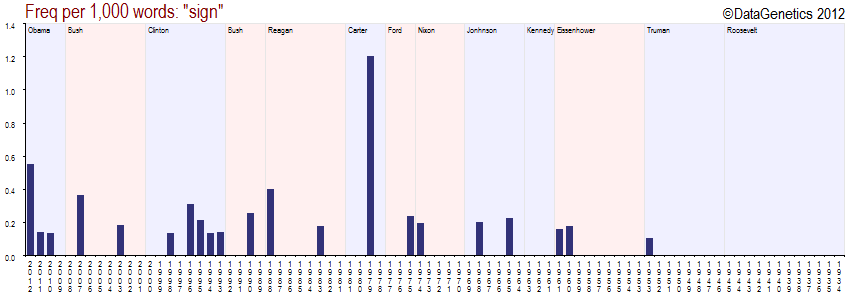
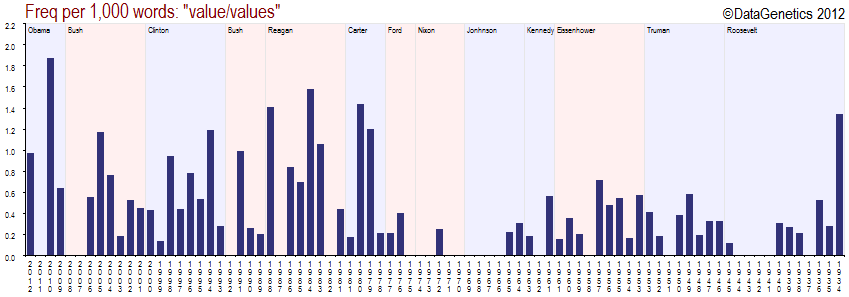
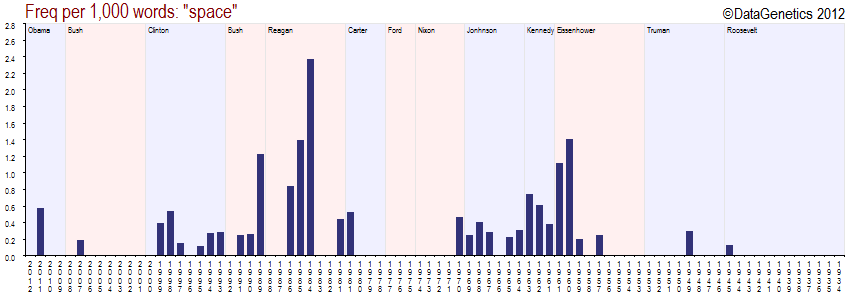
Below are individual charts showing the frequency of use of certain keywords in The State of the Union Addresses given by the Presidents of the United States. The date range is: 2012 President Barack Obama – 1934 President Frannklin D. Roosevelt.
The x-axis shows the year, and the y-axis depicts the frequency of use of that keyword in the speech, normalized by the length of each speech and represented as the frequency per 1,000 spoken words. For certain keywords, there are multiple canonincal forms of a word searched e.g. Worker and Workers. The chart counts any of these words as valid. The counting is case-insensitive and punctuation-insensitive.
NOTE – Certain years e.g. 1981 have two entries; one for the outgoing President (in this example President Carter), and one for the incoming President (in this example President Reagan). Light shading of the image background is used to depict Democrat and Repuplican parties.
This data is also available in Tabular Format. For background on this data, please read this page.


Check out other interesting blog articles.