
Standard Deviation Puzzle
A statistics puzzle today.
I have a set containing three numbers {1,2,3}
What number can I add to this set so that the standard deviation remains the same?

If you want to give it a go, stop reading now and spend a few minutes with a piece of paper.
How hard is this?
 |
At first glance, this appears pretty trivial problem, but hold on, no it’s not. If we add a number (that’s not the mean), then we change the mean of the set. If we simply add the mean of the numbers, then the standard deviation will not be the same. To keep the standard deviation constant, the mean has to change. |
Back to school
|
There are multiple formulas for describing standard deviation. Probably the one you are most familiar with is shown on the right In words: Find the mean of the set, then for each element find the error from this mean, square it, divide by the number of elements in the set (to find the ‘average’) then take the square root. Electrical engineers might also call this RMS (Root Mean Squared). |
 |
Using a bit of algebra, we can expand out the deviation formula. This is quite a common practice because, when calculating the standard deviation, we don’t want to have to keep a record of all the data points. As we will see, using this technique we can, instead remembering all the records, simply keep a running total of key summaries and still be able to evaluate the standard deviation (and do it on the fly).

After expanding the bracket, we can expanded out each term:

Things group together nicely, and simplify:

 |
This result above is a very useful one. What it shows us is that, if we want to calculate the standard deviation of a set of numbers, all we need to do is keep track of:
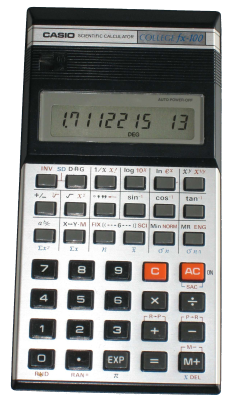
This is how your pocket calculator deals with generating these values when in statistics mode. By simply keeping track of these totals it can generate the mean and standard deviation of an arbitrarily large set of numbers. |
Back to the problem
All those square roots are a pain to deal with so, rather than comparing standard deviations, we can compare the square of these (which is given the name Variance).

For our little problem the variance after we add the new number needs to be the same as the variance before. We can equate these, noting N will be different on each side, and that on the right we need to have an additional number, which I’ll call M.

With a little bit of juggling we can reduce this down to a simple quadratic:


|
Now that we have this is standard form we can solve. |
And here we have the results. There are two possible solutions (which is what we’d expect as the solution to a quadratic)

The two solutions results in two possible sets with different means but the same standard deviation.
Graphing
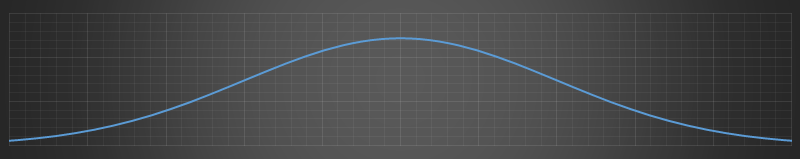
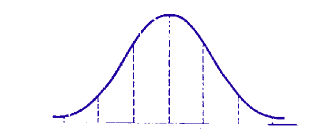
Some things look better with pictures. Here is a plot of the normal distribution for the original three numbers. Note the mean, and the standard deviation.
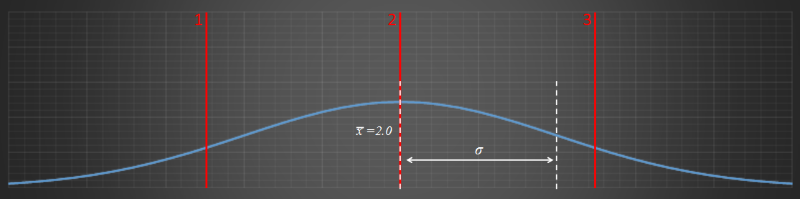
The standard deviation of the original numbers σ = sqr(2/3). The three numbers are depicted by the three red lines. The bell-curve is symmetric and centered around the mean, which is 2.
Interesting fact about normal distribution curves: The inflection points of a bell curve (the place where the curve changes from concave to convex) occur at ±σ
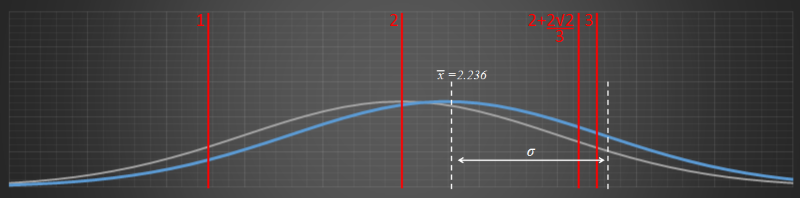
Below is a graph of the solution with addition of the number 2+(2sqr(2)/3) to the set. The mean has moved over, but the standard deviation remains the same.
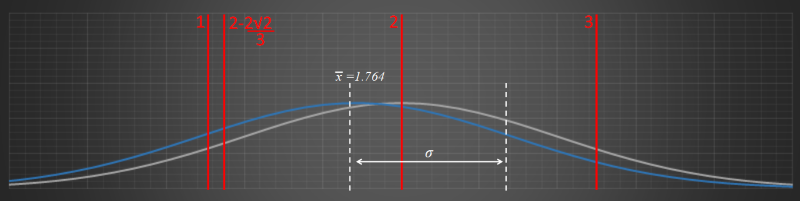
The other solution is plotted below. This is the curve with the addition of 2-(2sqr(2)/3) to the set.
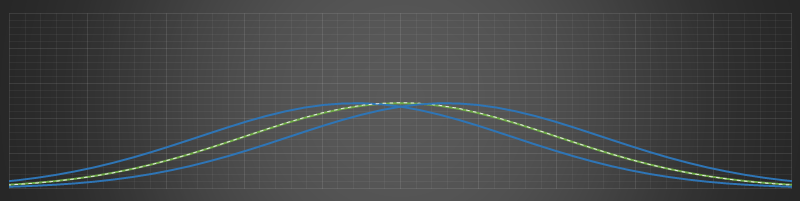
If we plot both solutions (in blue) against the original, we can see the symmetry:
Bonus: Changes in mean and standard deviation with changes to the set
 |
If we have a set of numbers and then add a constant (k) to every number, what happens to the mean and standard deviation of the set? Adding a constant k to every element in the set also increases the mean of the set by k. It does not, however, change the standard deviation (which is sort of like a measure of the average deviation from the average), which remains the same. You can visualize this by imagining the curve simply sliding over. |
|
If, instead of adding a constant k to every element, we multiply every element by k, what happens to the mean and standard deviation? In this case, the mean is also multiplied by k and so is the standard deviation. This should be clear from the formulas above. [Thanks, Danny] | 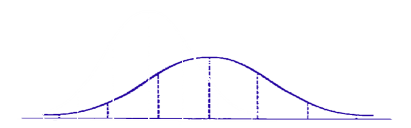 |
You can find a complete list of all the articles here. Click here to receive email alerts on new articles.

© 2009-2015 DataGenetics Privacy Policy