
Running in a Marathon (and Tanks)
|
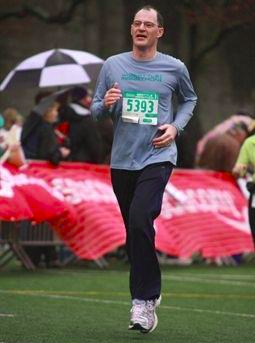
Over the last couple of years I’ve started running. I run for the exercise and try and keep myself healthy. To be honest, I find running a little boring so, to keep myself focused, I run the Seattle Half-Marathon every year. This year will be my 4th consecutive entry. The picture on the right shows me close to the finish at the event a couple of years ago. (Look, I'm still running in this picture! Both of my feet are off the ground). You’ll notice that I’m wearing the bib number 5393. So, here’s a question: Using just my bib number can we estimate the total number of entrants in the race? |
|
Bib number 5393
We can apply some common sense and some assumptions:
I'm going to assume that bib numbers start at #1
I'm going to assume that each bib number is unique
I'm going to assume that bib numbers increment by one and that there are no gaps
I'm going to say that there's an upper practical cut-off and that the race has fewer than 30,000 total entries
If you had to make a single guess as to the total number of runners in the race, knowing just my bib number, what would it be?
 |
Actually, this is a bit of trick question because it depends on how I am going to score your guess. For instance: Assuming we ran this experiment over and over again, should you try and guess the number that is most likely correct? (The answer that would be correct the most number of times if the experiment were repeated a lot). Or, should you try and guess the number that results in the lowest error term, such as a least squared error. (If we repeated the experiment many times, how would we minimize square of the error between the true answer and your prediction?) Or yet another way is to guess an answer that is unbiased; it does not favour answers, preferentially, to one side or the other of the true answer. We can do this by selecting an answer that will set the mean error to zero. |
Math Time
OK, time for a little more common sense. We know that my bib number is 5393. We know that there must be at least this number of runners in the race! Your guess must be greater or equal to my bib number.
Let's use the letter N to represent the actual number of runners in the race, and the letter i to represent my bib number.
If there are N runners in the race, then there ia a 1/N chance of me getting my bib number! (Where i ≤ N)
This is highest when i = N (When your guess is 5393). This is what statisticians call the Most Likely Estimate. This means if you guess 5393, you will be correct more times than by guessing any other number. (This also makes common sense, after all, it's the only bib number you've seen. It could be the answer. It's also the only number that could be in every solution).
The above answer might be the most likely answer, but it does not minimize the mean squared error. To help calculate this answer, let's define a constant a to represent the ratio of my bib number that you value you select.
The squared error for your guess can easily be calculated:

If we played the experiment N times and saw each possible size of race, once, the Mean Squared Error is:

Taking the first derivative w.r.t. our ratio a, and setting this to zero for the maximum, gives the following result:

At first glance this result doesn't seem amazingly helpful as it has the unknown N on the right hand side! (We need to know N in order to calculate a, which we are using to estimate N!) However if you look closely you see that the right hand side rapidly converges on 3/2 as N increases.
So, for all but small values of N, the best guess to minimize the squared error is 3i/2
If we want to find a unbiased guess, we need to compute the mean error, and set this to zero:

Again this gives a result containing N but, like before, as N increases the ratio asymptotes. To select an unbiased answer you should guess the number of runners to be 2i
Summary
|
Depending on how we score the guess here are the best ways to guess:
|
 |
More information
When I run a race, I see more bib numbers than just my own as I run. Every bib number I see gives more information about the size of the race. Every number I see helps me get a more accurate estimate of the size of the race.
It should be obvious that if I see a number higher than mine than it sets a new minimum for what the total number of racers could be. What may be not immediately obvious is that when I see numbers lower than mine it gives me information that helps me refine the accuracy of my prediction! How can that be the case?
Well thinking about it, if every number I see is lower than mine then it reinforces the confidence that my number is close to the end of the numbers list (if my number were in the middle, I would expect to see numbers either side of mine).
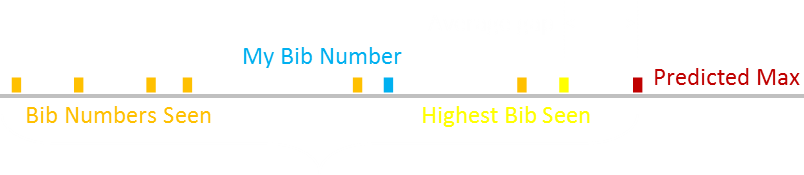
It turns out that a frequentist approach to estimating the total size of the race can be described as:
The maximum number seen in the sample plus the average gap seen between all observations in the sample
You can see this in the diagram below. Whilst I am running all I need to do is keep track of the highest number I see, and to keep a count of all the bib numbers I see.
In formula, if m is the highest bib number I see, and k is the number of bib numbers seen, then:

(This can be visualized by imagining that the samples are evenly spaced throughout the range. The average gap between samples is (m - k)/k; the -k being because the samples themselves are not counted in computing the gap between samples).
Example
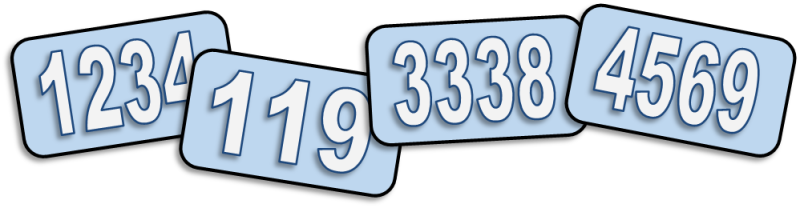
In running the race if, in addition to my own bib (5393), I saw the numbers:
1234, 119, 3338, 4569, 6667, 5431, 2747, 12, 256, 3278, 3624, 3669, 4978, 6001
Then m=6667 and k=15.
These figures give an estimate to the race size of 7110
WWII spies and German Tanks
During the course of the WWII the Western Allies made sustained efforts to determine the extent of German tank production, and approached this in two major ways: conventional intelligence gathering and statistical estimation.
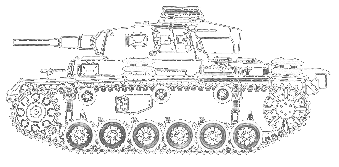 |
The statistical analysis was performed using the method described above. The allies noted that serial numbers inscribed on captured or destroyed enemy tanks followed incremental sequences (like my Marathon bib numbers). The principal numbers used were gearbox numbers, as these fell in two unbroken sequences. Chassis and engine numbers were also used, though their use was more complicated. Various other components were used to cross-check the analysis. Similar analyses were done on tires, which were also observed to be sequentially numbered. |
According to conventional Allied intelligence estimates the Germans were producing around 1,400 tanks a month between June 1940 and September 1942. Using statistical analysis, the number was calculated to be far less at 246 a month. After the war, captured German ministry production figures showed the actual number to be 245. Very impressive!
Here are some specific months:
| Month | Statistical Estimate | Intelligence Estimate | German Records |
|---|---|---|---|
| June 1940 | 169 | 1,000 | 122 |
| June 1941 | 244 | 1,550 | 271 |
| August 1942 | 327 | 1,550 | 342 |
Results as impressive as these make me proud to call myself a Data Scientist.
Bayesian Perspective
At the risk of, potentially, alienating half of my readers, we can also look at this problem from a Bayesian perspective (and also get some further insight into how viewing bib numbers lower than mine increases the confidence of our guess.
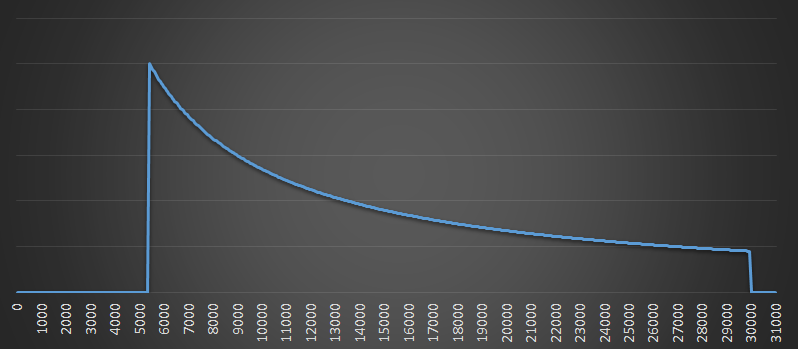
Below is a normalized graph showing the probability of your guess being correct (y-axis), against the predicted number of runners (x-axis). There is a cut-off below 5,393 (my bib number), and over 30,000 (the imposed maximum number of runners).
The curve follows the shape 1/N (recall that if there are N runners, you have a 1 in N chance that this is my bib number.)
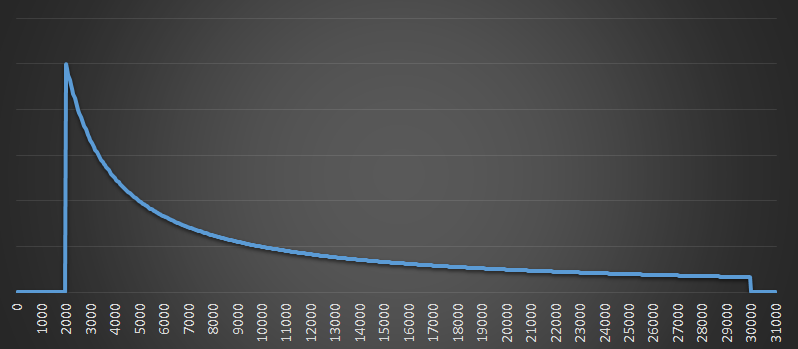
Now we see another runner with bib number 2,000. This is lower than my bib, but it also has it's own distribution curve.
This is where the magic works because we can now update our beliefs based on these two curves (insert hand wave here and combine the two curves to see the combined red results). The possible max number of runners (most likely answer) is still my bib number, but curve is getting tighter. The belief that there could be a very large number of runners is falling.
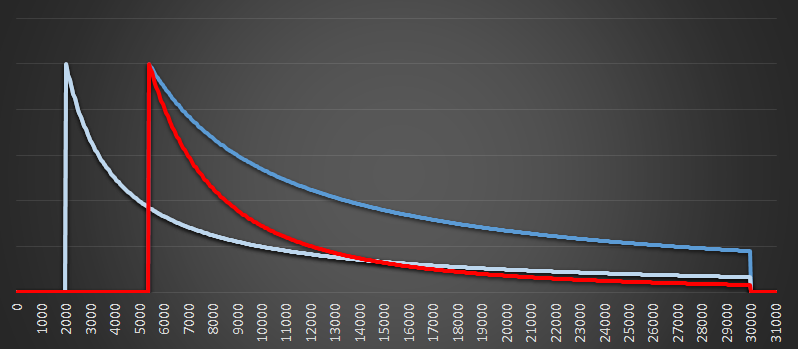
As we add more bib numbers, the combined probability function gets narrower still. Here is a graph when a dozen bib numbers have been seen. In this graph, there is a new max (we saw higher bib than mine), but you can see there red curve is now very narrow. All the numbers seen at the low end of the scale are suggesting to us that it is very unlikely there are more than 8,000 runners in the race, and the chances are practically zero that there are close to 30,000 runners.
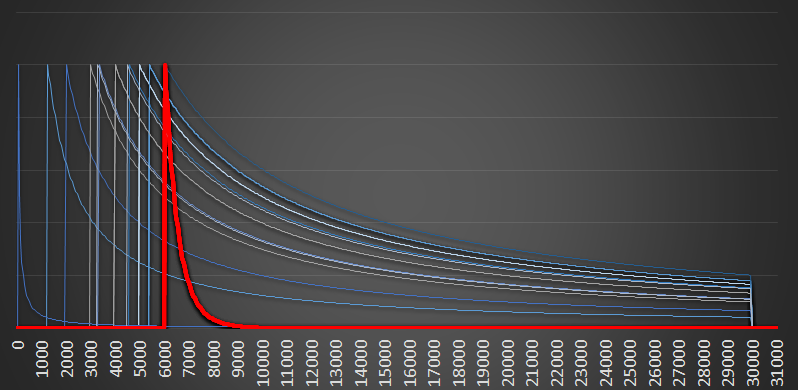
Again, this seems like common sense. If there were 30,000 runners, and we see a dozen at random, it would be highly unlikely that we'd see just the numbers at the lower end of the scale. Every additional low number we see reinforces and strengthens our belief about what the maximum is.
You can't catch me …
If you've had enough math for the day, relax, kick back and read The Oatmeal.
You can find a complete list of all the articles here. Click here to receive email alerts on new articles.
© 2009-2014 DataGenetics Privacy Policy