
Benford's Law
If youĺve not heard about Benfordĺs Law before, youĺre in for a real treat with this post.
Before we get into the theory, however, indulge with me in a little thought experiment. (Gedanken)
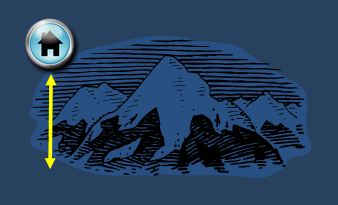 |
Imagine I have a database of randomly occurring measurements (for instance I just happen to have a database of the altitude of the top 122,000 populated towns in the World). If I were to plot a frequency histogram of this data based on the leftmost digit of each altitude (in feet), what do you think the shape of the graph would be?
|

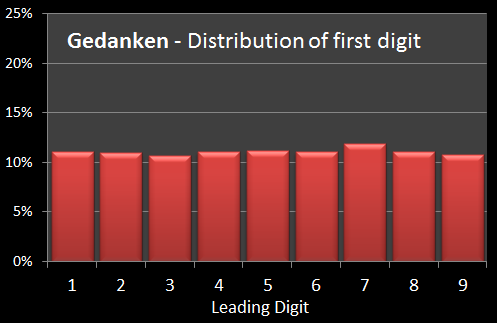
Gedanken Experiment
|
Something like this perhaps? With sufficient data, you'd expect the first digit should be reasonably randomly represented, right? Within a small margin the bars should be of similar height all the way from 1-9, right? (At around 11%, since there is no zero, just the digits 1-9). Wrong! That's not the shape we get … |
 |
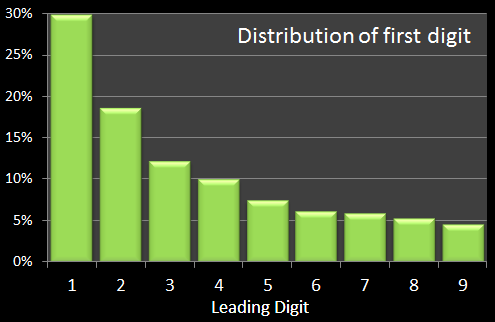
Actual results
|
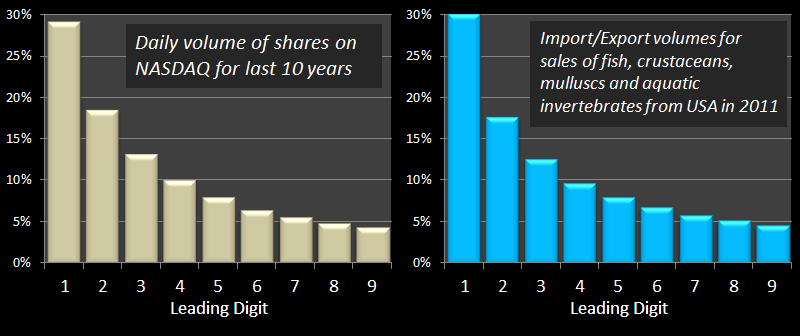
In fact, if you plot the actual histogram of first digits, you get the chart on the right. Yes, that's right, altitudes where the first digit is the number 1 occur significantly more often than the number 2 which, in turn, occurs more frequently than the number 3 … all the way down to the number 9. In truth, the number of times when the first digit is a 1 is almost 30% of the time; Six and a half times as often as it in the number 9 (which occurs less than 5% of the time)! |
 |
Huh !!? Whatĺs going on?!? Is there some sampling effect going on?
Curiouser and curiouser!
But wait, thereĺs more … It gets even more puzzling.
Instead of plotting the chart based on altitude measured in feet, letĺs say I convert all the altitudes into Meters (I like the Metric system), and plot the chart again. Surely this will change the shape of distribution?
Nope! The chart below, on the left, shows the plot using height in Meters.
If we recreate the chart, yet again, but this time using the height data converted into the ancient unit of measure the Royal Egyptian Cubit, we get a similar shaped distribution (One Royal Egyptian Cubit = 523 mm). Shown in the chart on the right.
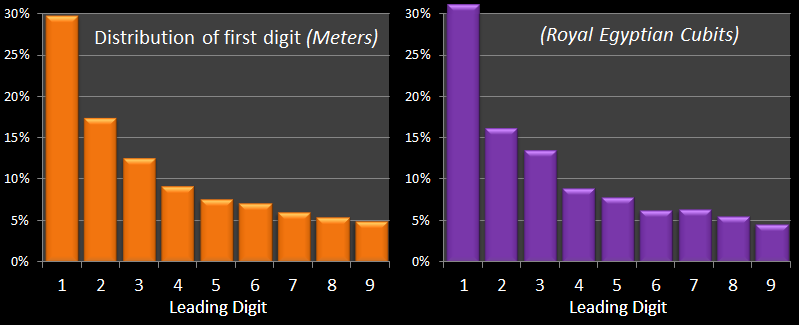
In fact, it does not matter which units I plot the data in (meaning it does not matter what arbitrary scale conversion factor I apply), the distribution of the leading digit follows a similar curve.
Itĺs not just altitude of places, I can repeat this exercise with other data sources, such as stock market volume, distances to stars in the Universe … and I'll get comparable distribution patterns. In all these examples, the leading digit is the number 1 approximately 30% of the time, and distriubtion of the other digits falls off the same way.
Something is clearly going on here.
History
|
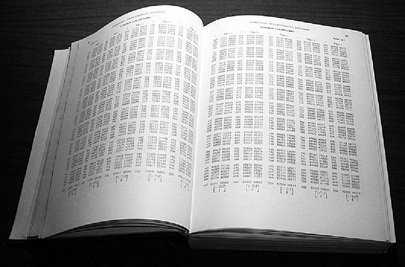
This phenomenon is called Benford's Law after physicist Frank Benford, though it was first documented by Simon Newcomb, a Canadian mathematician, much earlier, in 1881. Newcomb discovered that, when using his book of log tables, the earlier pages (which contained numbers that start with 1) were much more worn than the other pages. Benford rediscovered this observation in 1938 and, as a great example of Stiglerĺs Law, it is named after him. |
 |
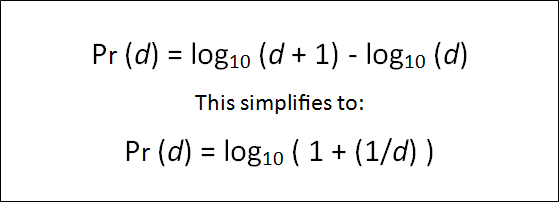
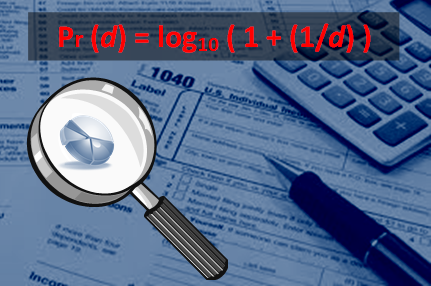
Benford's formula states that the probability of the leading digit being of a certain value can be described by the following function:
Here is a graph plotting Benford's function against our database of entity altitudes in a the three scales we looked at.
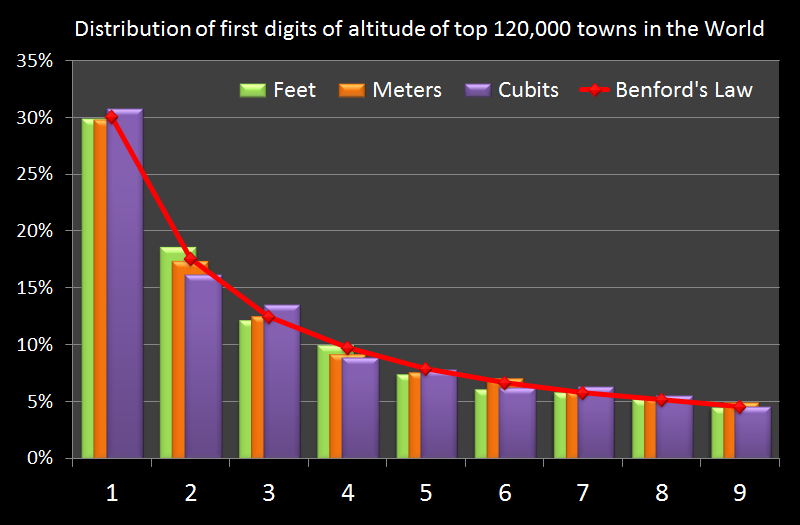
I think you'll agree it's a pretty good match.
|
|
The table on the left shows the prediction, in tabular format, from Benford's Law. The table on the right shows the distribution of data based on frequency as plotted in the different units.
How / Why does it work?
|
This scale invariance distribution is hard to wrap one's head around, but I'll try to explain it with another thought experiment. You can see from the formula it's based on the logarithm of the number. Try to imagine a pencil of one unit length (it does not matter what 'one unit' means to you). |
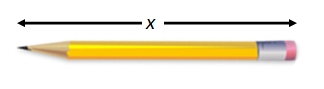 |
Now imagine that pencil slowing growing in length. It grows and it grows. For a long time, it will be of length 1.x units long. In fact, it will have to double in length (100% change) before the leading digit changes from 1 to a 2.
However, if it had a leading digit of 2, then it would only need to change in length 50% to change the leading digit from a 2 to a 3.
Look at the logarithmic scale above, you can see that as we move along the scale, there's a shorter distance between each subsequent mark until the next decade is achieved. At the edge of a decade, to change from a leading digits from a 9, requires only an 11% change in the value of the number.
We can see that the percentage of time that the leading digit is a 1 occurs approximately 30% of the time (the areas shaded red in the diagram below).
The probability of each digit being represented in the data is proportional to the area of the corresponding regions in the logarithmic chart. I've color coded them in the picture below.
The width of each colored segment is proportianal to log10(d+1) – log10(d)
|
(The mathematicians in the audience will realize that it is possible to generalize Benford's formula to any number base by changing the logarithms from base-10 to the logarithms of the number base you are using.) |
Interesting Applications
|
Most people who commit fraud with numbers are not aware of Benford's Law. Tables of figures in tax-returns, expense reports, sales records and voting record volumes, for instance, should all follow a Benford distribution. A deceptive person, trying to fabricate "Random" values to insert into a report will, most likely, select numbers that appear to them as unsuspicious. They will probably select numbers with initial digits that are more uniformly distributed across the number range. As we now know, this is very, very wrong! There is an entire industry specializing in forensic accounting and auditing which uses these phenomena to look for inconsistencies in data. |
 |
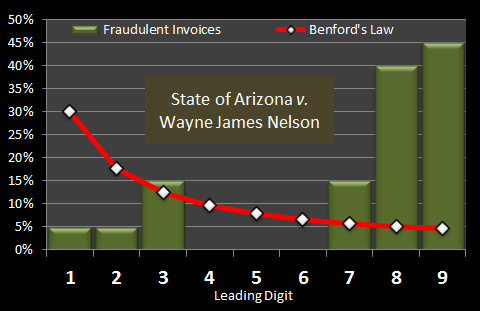 |
In 1993, in State of Arizona v. Wayne James Nelson (CV92-18841), the accused was found guilty of trying to defraud the state of nearly $2 million, by diverting funds to a bogus vendor. The perpetrator selected payments with the intention of making them appear random: None of the check amounts was duplicated, there were no round-numbers, and all the values included dollars and cents amounts. However, as Benford's Law is esoterically counterintuitive, he did not realize that his seemingly random looking selections were far from random. |
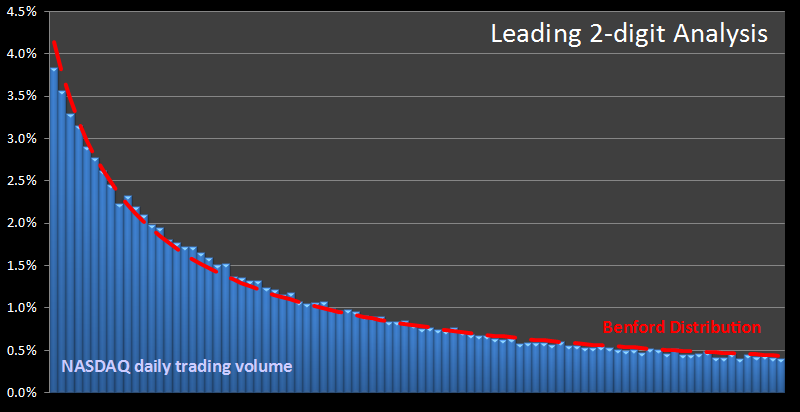
It's not just the leading digit
Benford's Law does not just apply to the first digit. The system can be applied to look at the expected distributions for the first n-digits of numbers. Here, for instance is the same NASDAQ data plotted based on the leading 2-digits alongside the theoritcal Benford distribution.
Thanks for reading. Now go out and forward this link to a handful of your friends to educate them about this fascinating phenomenon.
You can find a complete list of all the articles here. Click here to receive email alerts on new articles.
© 2009-2013 DataGenetics