
Rock, Paper, Scissors
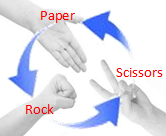 |
Most children are taught to play Rock, Paper, Scissors at an early age. It's a fun game to teach kids, and one where the strategy of winning (which in theory should be totally random), is based on psychology. It's a game about predicting the next move of your opponent. If you can accurately predict the symbol your opponent will ‘throw’ you are always able to select a different symbol and get a win. |
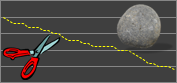
This is possible because of the cyclic nature of the rules for the game:
 |
Rock blunts Scissors |
 |
Scissors cut Paper |
 |
Paper wraps Rock |
The cyclic property of this scoring system is given a fancy name: Intransitivity
Intransitivity
What does that mean? A Transitive function or property is something in which all comparisons are performed according to the same dependent criteria. For example, if Albert is older than Bob, and Bob is older than Charlie, then we know that Albert must be older than Charlie too.
 |
This is because "is older than" is a Transitive function. However, if I told you that Albert is friends with Bob, and Bob is friends with Charlie, you can’t assume that Albert is also friends with Charlie! This is because "Friendship" is Intransitive. You can read a little more about intransitive games on my posting about How to win free drinks from your friends using dice. |
Rock, Paper, Scissors
There are numerous articles on the web that talk about strategy from the psychological perspective. I’m not going to repeat this work. If you want to read more on that angle, Google is your friend. There are also some very interesting articles about strategies for writing computer 'bots to play against human players.
What I am going to look at in this article is sensitivity analysis based on the different concentrations and populations of players and moves (I’ll explain all in just a moment).
Dynamic Equilibrium
|
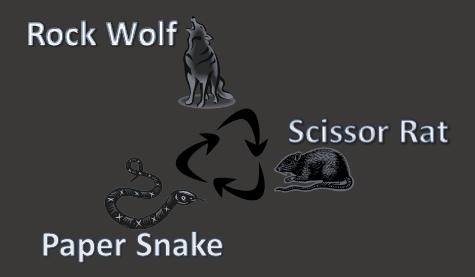
First, however, let’s take a detour and talk a little biology. Imagine there are three organisms living on a fictitious island in the Pacific Ocean. These are the Rock Wolf, the Scissor Rat, and the Paper Snake (I think you can see where I am going with this). The Rock Wolf feeds entirely on the Scissors Rats. Scissor Rats’ exclusive diets are Paper Snakes, and Paper Snakes attack, with extreme prejudice any Rock Wolves they see. None of these animal species is cannibalistic to their own species. Each animal has a unique prey, and a unique nemesis. |
 |
 |
On this island, there is a natural state of dynamic equilibrium with the three species balancing each other out. Now imagine what would happen if, suddenly, half the snakes disappeared? How would this effect the ecosystem? How would it change the balance and the ecosystem? |
Back to Rock, Paper, Scissors
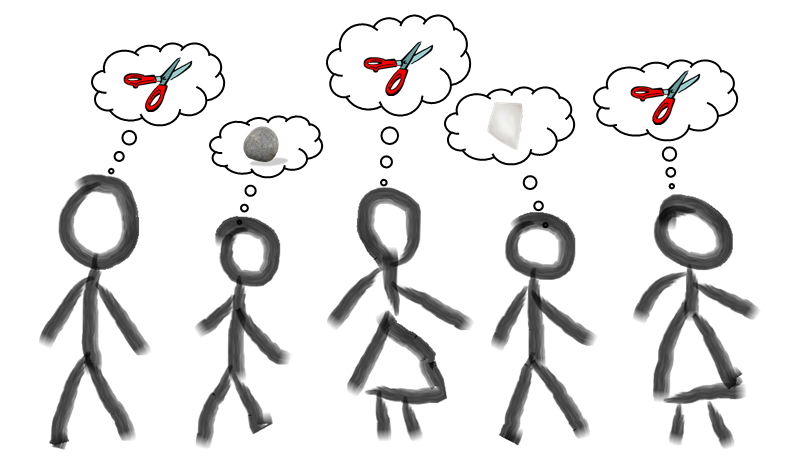
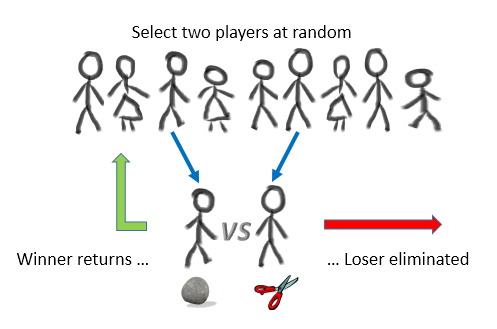
Imagine there are a lot of people in a room, and they are going to play a giant game of rock, paper, scissors. However instead of autonomy in selection, their choice of Rock, Paper, Scissors is pre-ordained. They are automatons and always play the same move.
To play each round, two random people are selected from the pool (the players still in the game) and challenge one another. Each plays his/her allocated move. The winner goes back into the pool to fight another day. The loser leaves the game. (In the event of a tie, both players return back to the pool).
Over time, the number of people in the pool gets fewer. Eventually we’ll be left with just one class of participants. Because, obviously, when we are down to just one remaining class there is nobody who they can attack, or they can get attacked by.
(In fact, once any one of the populations gets to zero it's a sure conclusion for the winner of the game).
 |
The class that survives is determined to be the winner (this could be as few as one person). I hope you can see the analogy between the Rock Wolf, Scissor Rat and Paper Snake! |
Mixtures
|
The probability of being the winning tribe depends of the concentrations (relative ratios) of the starting players. The starting conditions effect the chances of surviving to the end. Obviously, if the ratios of Rock, Paper and Scissors at the start of the game are the same, the probabilities of being the last tribe standing are the same (This should be obvious from symmetry, and from the fact the intransitive property that each class is the same with exactly one strength and one weakness each). |
 |
To work out what happens with non-equal starting conditions, we need to model the system.
Monte-Carlo Simulation
To model this system, I wrote code to perform this contrived Rock, Paper, Scissors game using a random number generator to select two opponents for each round. Each game was played to completion. To get smooth results, I repeated this exercise 10,000 times for all combitions of starting players from 1-50 of each symbol. I counted the number of times the Rock team won, the number of times the Paper team won, and the number of times the Scissor team won. I also recorded the average number of rounds that were required to produce a winner.
Results
|
Below are some sample results. The three columns on the left show the number of starting players for each symbol. The three columns to the right of these are the number of times (out of 10,000 games), that each symbol was the winning item. The final column shows the average number of battles until a winner is found. |
 |
First a few obvious results:
| # Rocks | # Paper | # Scissors | Rock Wins | Paper Wins | Scissor Wins | AVG moves | |
|---|---|---|---|---|---|---|---|
| 1 | 1 | 1 | 3,317 (33.17%) | 3,292 (32.92%) | 3,391 (33.91%) | 2.000 | |
| 2 | 2 | 2 | 3,333 (33.33%) | 3,356 (33.56%) | 3,311 (33.11%) | 5.705 | |
| 3 | 3 | 3 | 3,355 (33.55%) | 3,338 (33.38%) | 3,307 (33.07%) | 9.889 | |
| 4 | 4 | 4 | 3,352 (33.52%) | 3,360 (33.60%) | 3,288 (32.88%) | 14.289 |
It's no great surprise, as mentioned earlier, that if the distribution of starting entities is symmetrical, so are the results. As you can see, when the number of starting rocks, paper and scissors are equal, the percentage time each wins is approx the same at 33.3% (when averaged out over 10,000 games - the minor differences down to the quality of the random number generator and the sample size).
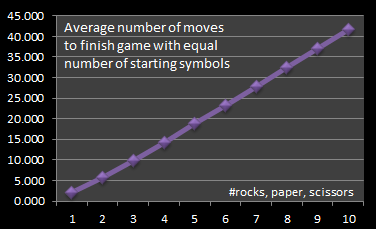 |
The average number of moves required to win increases with the number of people playing (another obvious result!) The number of moves required to win with just one of each symbol is obviously two. It does not matter which combination of the three are put together for the first round; one will obviously win, and one will lose. There are then just two entities left (by definition these will be different), so it is game over after this round. As soon as we have more than one of any symbol there can be a tie. A tie increases the number of rounds the game is played, even though nobody is eliminated. |
Things get really interesting when we start to adjust the relative concentrations.
Below, I've kept the number of starting Rocks and starting Papers at ten, and adjusted the number of starting Scissors. Can you predict what will happen?
| # Rocks | # Paper | # Scissors | Rock Wins | Paper Wins | Scissor Wins | AVG moves | |
|---|---|---|---|---|---|---|---|
| 10 | 10 | 10 | 3,351 (33.51%) | 3,309 (33.09%) | 3,340 (33.40%) | 41.606 | |
| 10 | 10 | 9 | 2,802 (28.02%) | 3,304 (33.04%) | 3,894 (38.94%) | 40.172 | |
| 10 | 10 | 8 | 2,307 (23.07%) | 3,304 (33.04%) | 4,389 (43.89%) | 38.870 | |
| 10 | 10 | 7 | 1,819 (18.19%) | 3,273 (32.73%) | 4,908 (49.08%) | 37.852 | |
| 10 | 10 | 6 | 1,299 (12.99%) | 3,310 (33.10%) | 5,391 (53.91%) | 36.989 | |
| 10 | 10 | 5 | 900 (9.00%) | 3,190 (31.90%) | 5,910 (59.10%) | 36.646 | |
| 10 | 10 | 4 | 521 (5.21%) | 3,401 (34.01%) | 6,078 (60.78%) | 36.462 | |
| 10 | 10 | 3 | 222 (2.22%) | 3,866 (38.66%) | 5,912 (59.12%) | 36.244 | |
| 10 | 10 | 2 | 78 (0.78%) | 4,804 (48.04%) | 5,118 (51.18%) | 35.659 | |
| 10 | 10 | 1 | 6 (0.06%) | 6,611 (66.11%) | 3,383 (33.83%) | 33.336 |
This is fascinating stuff. As we decrease the number of scissors, at first, the percentage of times that the scissors will win increases!!!
How can this be? Well, the nemises for the scissors is, of course, the rock. With a lower number of scissors, it's more likely that a battle will take place between the rock and the paper (which the paper will win), reducing the number of rocks.
|
This pattern increases as the number of starting scissors decreases, peaking, then falling as the number of scissors is very low. When the number of scissors is very low, just a couple of bad pairings can lose the game. The chances of rock winning decreases as the number of scissors decreases. Rocks are not afraid of scissors, and there is the added bonus that scissors take out paper. When there are no scissors to take out paper, the rocks will eventually die. |
 |
The keys to winning in this survival race are not just to be strongest yourself, but to make sure that enemy of your emeny is also strong. It's a cliché, but "the enemey of your enemy" really *is* your friend (until you have to finally eat him too to win!)
"The enemy of my enemy is my friend"
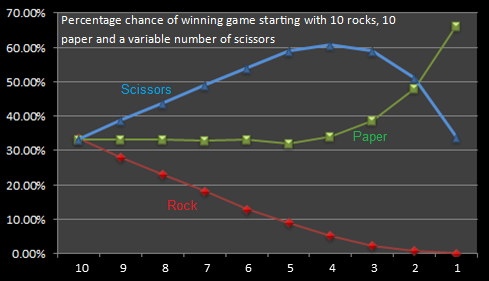 |
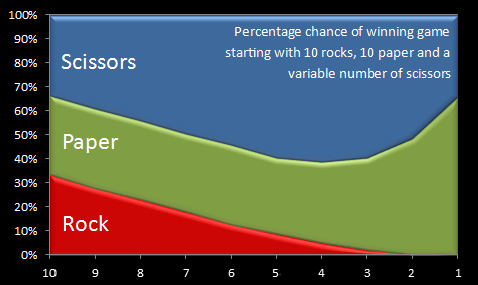
Here is the same data plotted as individual percentages. The paper, initially, in this example is less sensitive to changes in the environment, keep close to the same percentage of winning as the number of scissors decreases. It's only at extreme changes that that is can rise to dominance. The perentages for Rock and Scissors, however, change noticebly straight away. |
As we increase the population sizes, however, the paper does become more sensitive to changes in scissors. Here is a similar graph showing the percentages chance of winning starting with 50 of each symbol instead. You can find the tabular data here.
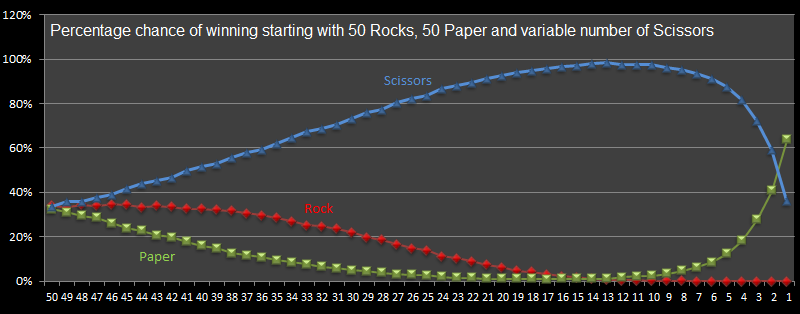
Interestingly, for these data sizes, the peak chance for scissors to survive is when we start with 13 of them. This results in a percentage chance of victory at over 98% when battling 50 Rock and 50 paper! Who would have predicted that?
Another interesting phenomenon is that, as the population sizes increases, the stability of Rocks remains constant longer (and higher) as the scissors decrease cf. this being paper when the population is small.
The chance of a rock winning falls monotically (it never increases again), unlike paper, which does. When the number of starting scissors is 17, the chances paper winning is at a minimum, and this percentage chance increases with the number of scissors. It passes the chance for rock winning at 13, and goes on to overtake scissors at 1.
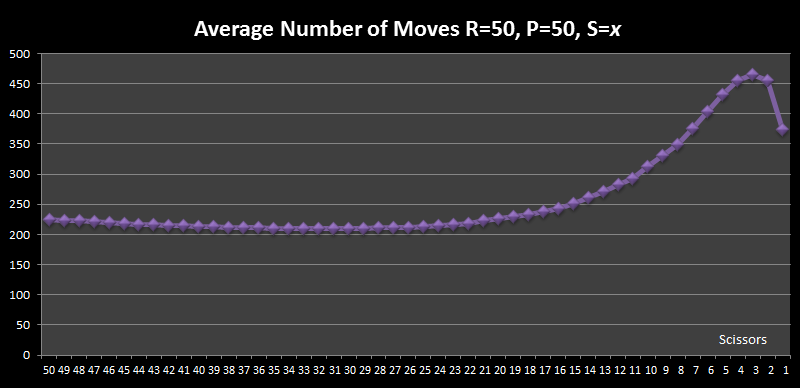
The average number rounds to find a winner has an interesting shape curve too, with a noticeable peak, and a shallow minimum. It's expected that as the number of scissors increases the number of moves should increase (there are, after all, more people playing the game!), but increasing also lessens the chance of a tie, which uses a round and causes no elimination.
Changing more than one variable at once
Below is a table of keeping the number of scissors constant, and this time reducing the starting numbers of both Rocks and Paper.
| # Rocks | # Paper | # Scissors | Rock Wins | Paper Wins | Scissor Wins | AVG moves | |
|---|---|---|---|---|---|---|---|
| 10 | 10 | 10 | 3,351 (33.51%) | 3,309 (33.09%) | 3,340 (33.40%) | 41.606 | |
| 9 | 10 | 9 | 3,324 (33.24%) | 2,839 (28.39%) | 3,837 (38.37%) | 38.557 | |
| 8 | 10 | 8 | 3,148 (31.48%) | 2,334 (23.34%) | 4,518 (45.18%) | 35.645 | |
| 7 | 10 | 7 | 2,856 (28.56%) | 1,880 (18.80%) | 5,264 (52.64%) | 33.034 | |
| 6 | 10 | 6 | 2,352 (23.52%) | 1,513 (15.13%) | 6,135 (61.35%) | 30.531 | |
| 5 | 10 | 5 | 1,664 (16.64%) | 1,131 (11.31%) | 7,205 (72.05%) | 28.346 | |
| 4 | 10 | 4 | 1,026 (10.26%) | 916 (9.16%) | 8,058 (80.58%) | 26.631 | |
| 3 | 10 | 3 | 445 (4.45%) | 746 (7.46%) | 8,809 (88.09%) | 25.704 | |
| 2 | 10 | 2 | 94 (0.94%) | 637 (6.37%) | 9,269 (92.69%) | 26.586 | |
| 1 | 10 | 1 | 4 (0.04%) | 1,014 (10.14%) | 8,982 (89.82%) | 31.224 |
Here there are multiple things going on. In the last row, where paper dominates, it's chances of victory are still slim because, to win outright, it needs to defeat the scissors at some point. There is only one piece in game that can take out the scissor, and that is the one rock in the game. Sadly for paper if he meets the rock in game before the scissors, he takes away his only chance of being able to get a win.
Ternary Mixture
 |
Changing two of the three variables at the same time is hard to visualize, and also changing the denominator of the sample each time does not create a strictly level playing field (each time an additional scissor is added it changes the total number of players in the game). A better way to plot this data is in the form of a Ternary Mixture Plot, and the use of concentrations. This is the kind of thing Scientists (especially Chemists) do when looking at mixtures of three substances. |
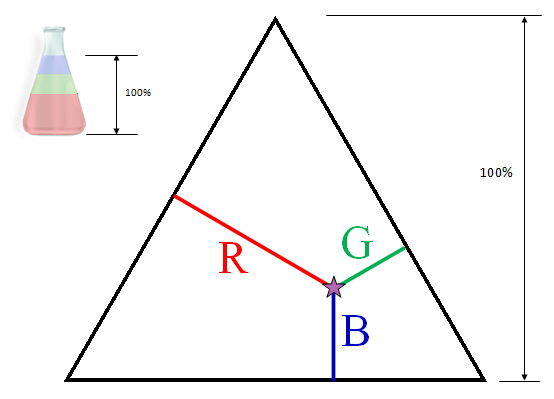
Imagine we have a 50 ml flask. In this we wish to place various combinations of three liquids: R, P, S to test their properties.
We are constrained, because the flask can only hold 50 ml, and we also want to see the effect of different concentrations of mixtures. We can do this by making sure the flask is always full, then selecting one of the liquids, say R, and looping through each volume of this first liquid from 0-50 ml. Then, we will fill the remaining space with the various combinations of P and S to top up the flask.
Since the volume in the flask is constant, this allows us to appreciate how the change in concentration effects things.
|
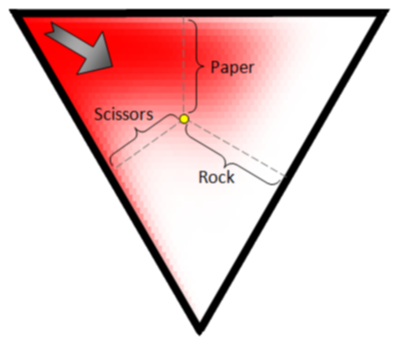
This data can be plotted inside an equilateral triangle, where the height of the triangle represents the full volume. Every point inside the triangle represents various concentrations of the the components as percentages of the whole. Each corner of the triangle represents a pure substance, and moving around the edges represents various binary mixtures. Since every point within the triangle has the property that the sum of the perpendiculars from that point on the sides of the triangle is equal to the height of the triangle, it is evident that the composition of a ternary mixture can be represented by fixing a point within the triangle such that the lengths of the perpendiculars from the point to the sides of the triangle are equal respectively to the fractional amounts of the three components present. |
 |
Rock, Paper, Scissors Ternary Plot
Below is the Ternay Plot for the all the mixture of starting conditions for Rock, Paper, Scissors
The data used for this plot is all combitions of starting conditions up to 50 people.
|
RED |
Red is used show the percentage of times Rock wins the game. |
|
GREEN |
Green is used show the percentage of times Paper wins the game. |
|
BLUE |
Blue is used show the percentage of times Scissors wins the game. |
The brighter the color, the higher the percentage chance of that class being victorous. Each of the three primary colors are mixed for each pixel. As we expect, there is rotational symmetery in the plot.
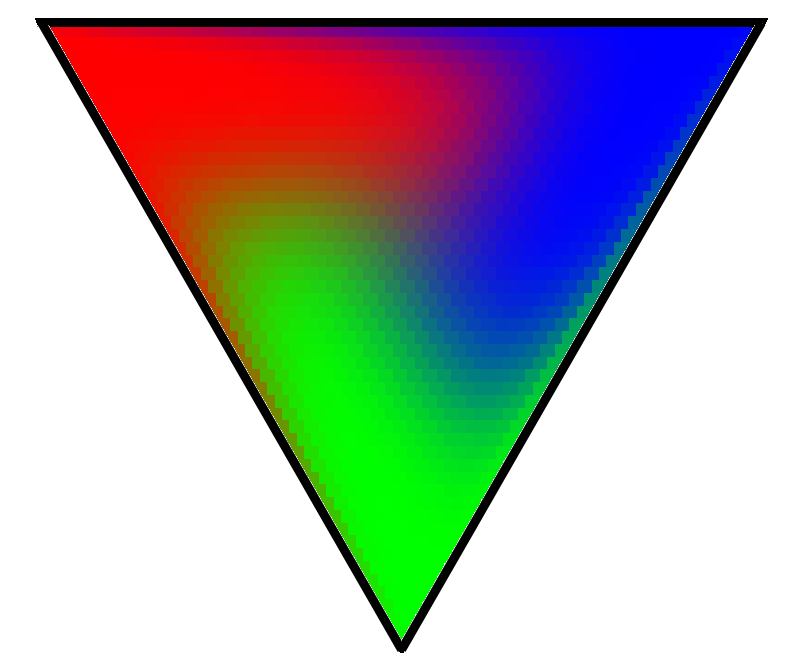
The top left corner shows pure Rock and as we move away from this, in a direction perpendicular to the opposite wall, we decrease the concentration of Rocks in the starting conditions.
|
Similarly for Paper and Scissors from the other two corners. |

|
These three plots merge together to form the final chart. Pretty!
You can find a complete list of all the articles here. Click here to receive email alerts on new articles.

© 2009-2013 DataGenetics Privacy Policy