

Newsletter: Click here to join an email list and be contacted when a new article is published.
Advertisement |
|
Voronoi Soccer

In the last article, I wrote about Voronoi Tessellations.
In that article, for my examples, I used randomly generated points. This week, I searched the web looking for some real data that I could apply this technique to and came upon this excellent data set - positional data from a professional soccer game. With a sampling frequency of 10Hz, coordinates for each of the 22 players (and the football) were recorded. It’s a wonderful dataset, and fun to play with.
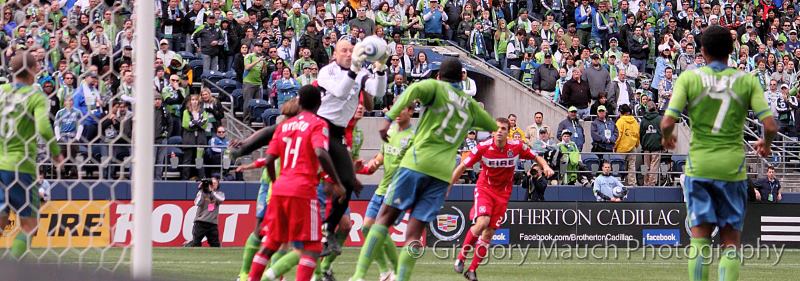 Image: Gregory Mauch
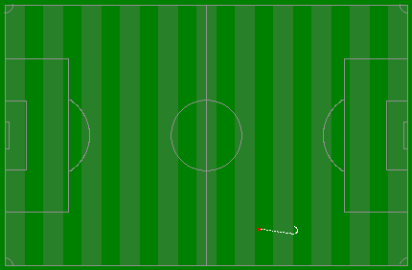
Player Data
Here's the data for one of the players. I added snail trail so you can see the direction of movement. There is also a short animation of this. If your browser supports animated PNG files, click on the top button on the right. As a fallback, click on the lower on the right to view the file as an animated GIF (image quality is not as good, and the files are considerably larger).
 |
View animation as View animation as |
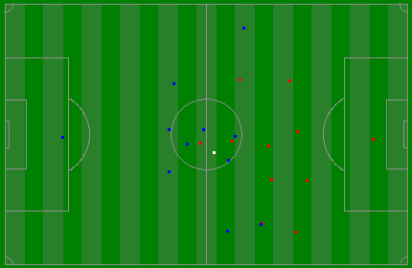
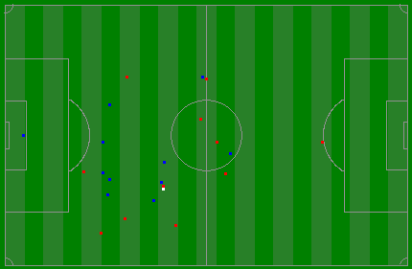
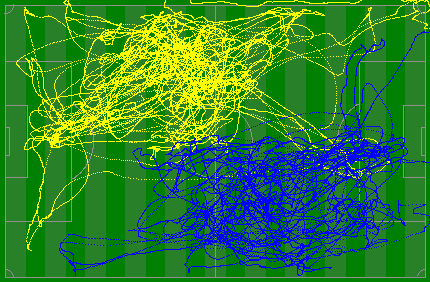
Game Data
Here's a few minutes of the match with all players rendered taken at two different times in the game. Both sections are from the first half where the red players and going refom right to left, and the blue players from left to right. The white dot represents the ball. Note - there appears to be the occassional glitch in the ball and it soemtimes jumps (I'm guessing it is sometimes moving too fast to track), and also sometimes it goes out of bounds (when there is a throw in or corner) and disappears.
 |
View animation as View animation as |
 |
View animation as View animation as |
Player Positions
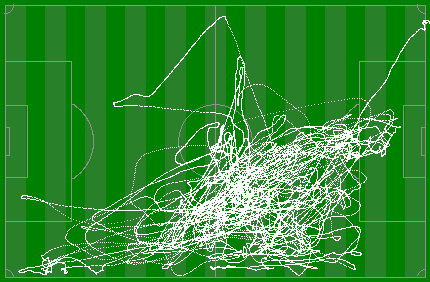 |
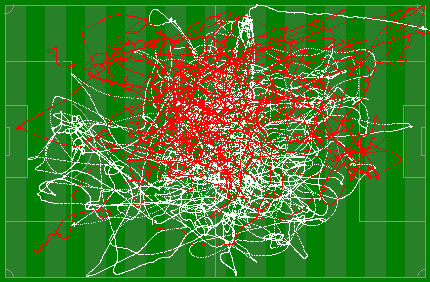
Here's a snail trail of one of the players for the first half of the game. (He's playing right to left). You can see how he plays the left-wing and midfield (left full-back?)*. He hardly ever crossed the center line into the right hand side of the field. Also, other than a little defending, he seems to stop short of his own penalty box. The line going up at 45° in the top right is the player walking off the field at half time! *Confession - I know very little about soccer, other than watching my son play his games. Please forgive me if I use the incorrect terms. |
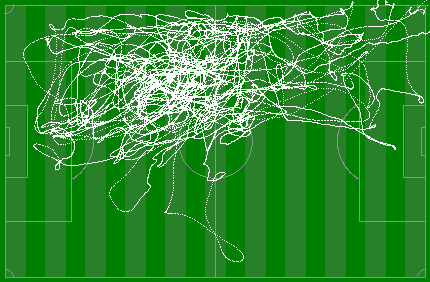 |
Here is the same player in the second half of the game (this time playeing from left to right). You can see in the second half he's pushed forward more, and used a little more of the center field (but still staying on his side). |
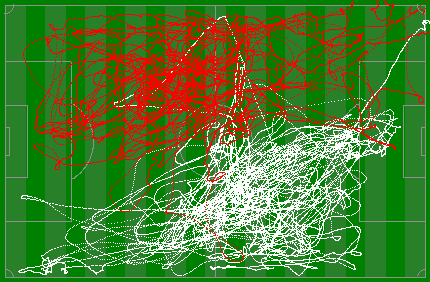 |
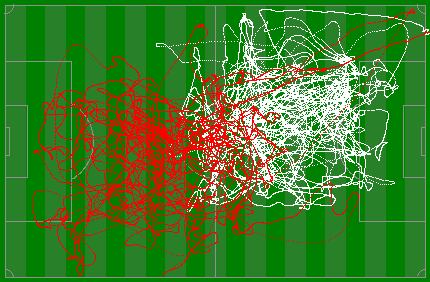
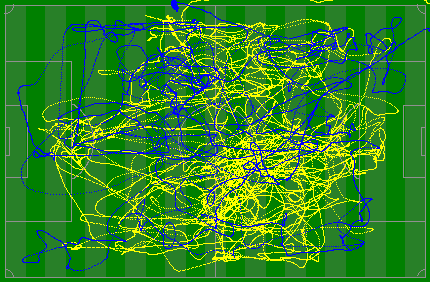
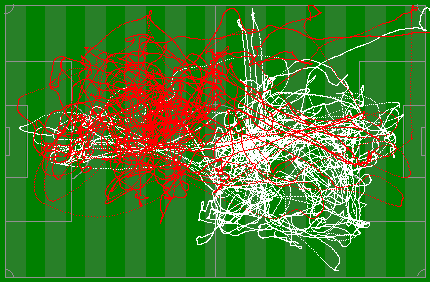
Combining the two images, I've used White to show the first half of the game, and red to show the second half. You can see the rotational symmetry. |
All players
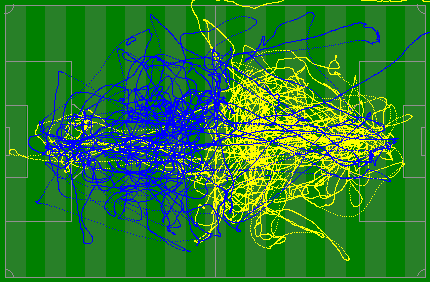
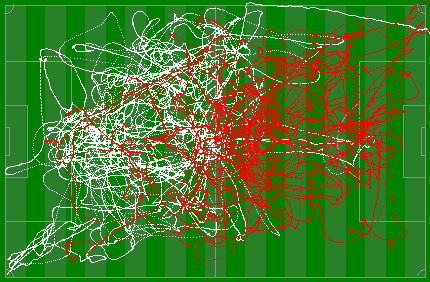
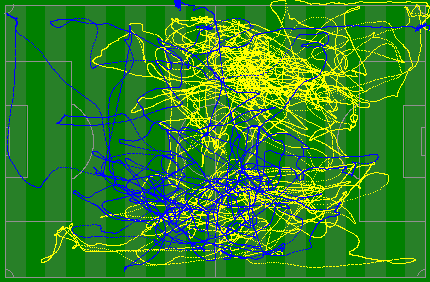
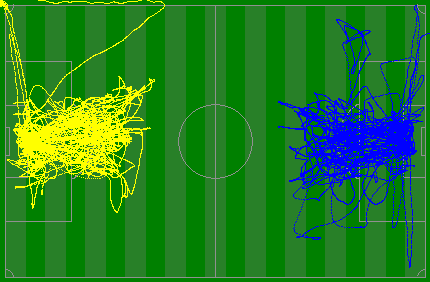
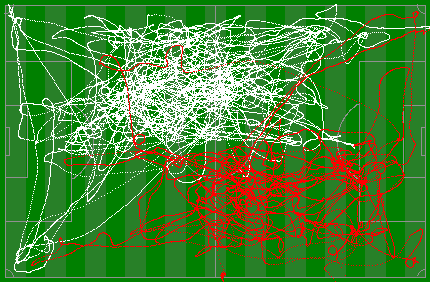
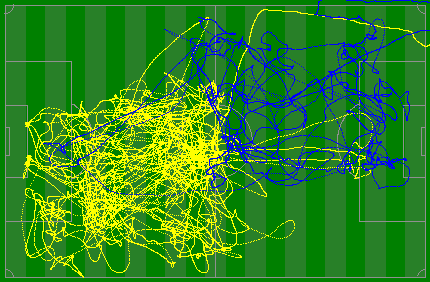
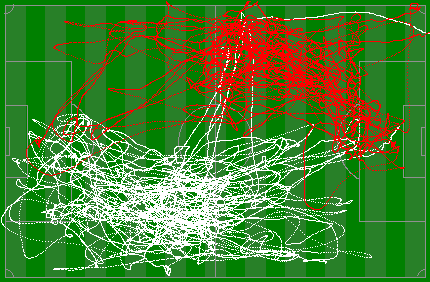
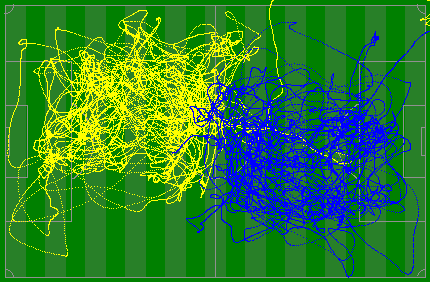
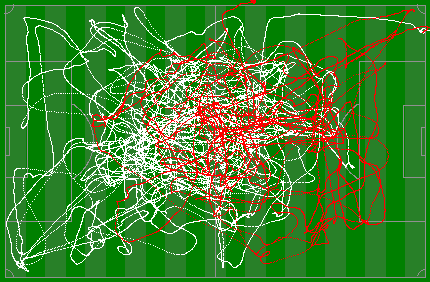
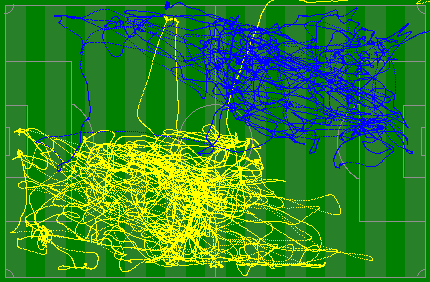
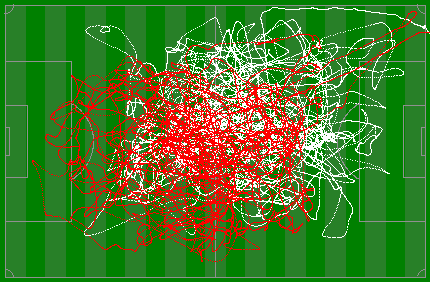
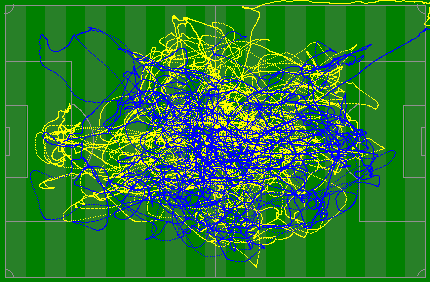
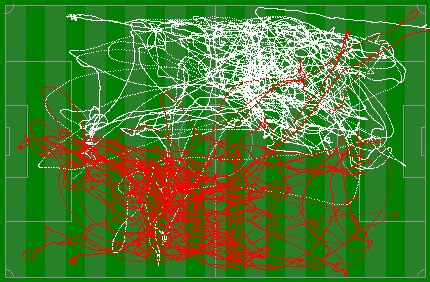
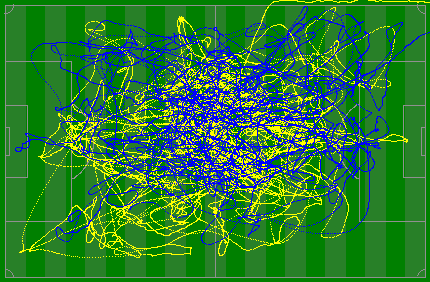
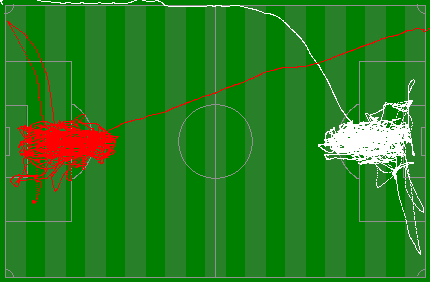
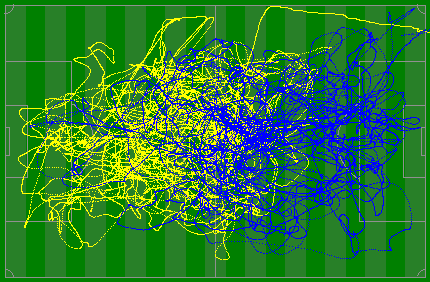
Here are plots of all twenty two players in the game. The left column shows team #1, with white/red for each half, and the right column shows the players in team #2, using the colors yellow/blue.
It's pretty each to see which player is the goalie for each team!
Can you see the defenders? striker? left-wing? right-wing? midfielders? …
|  |
 |  |
 |  |
 |  |
 |  |
 |  |
 |  |
 |  |
 |  |
 |  |
 |  |
Voronoi
 |
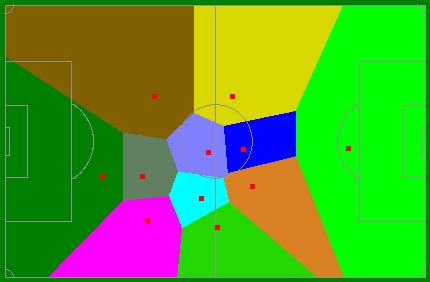
Using the players' positions as nodes, I generated Voronoi Tessellations for each team. Below is the data for team #1. On the assumption that the nearest player might have (or run to) the ball, it shows which player is nearest the ball for any field location, should they want to run to it. If the players are bunched together, their Voronoi regions will be small. As they spread out, their regions increase as they are responsible for more of the field. |
Below is an animation of the first ten minutes of the first half. You can see the ebb and flow of the players up the field as they alternate between attacking and defending, and how much of the field the goalie would be nearest to when the rest of players push forward. Each player keeps their own shading color throughout the animation.
It's pretty mesmerizing to watch!
 |
View animation as View animation as |
Delaunay Triangulations
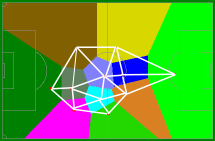 |
As explained in the previous article, there is a direct relationship between Voronoi tessellations and Delaunay triangulations. If we assume a player with the ball only passes to a nearby player, the Dealanay triangulation shows the possible passes to other players that a person with the ball can make. |
Experiment Yourself
As mentioned earlier, the data set I pulled for this article is pretty spectacular if you want an interesting dataset to experiment with. In addition to positional data, the set contains data on possession time, number of passes, time in control of the ball, distances, and speeds. You could produce some great data visualisations, and maybe some machine learning to predict where the ball might be based on player position, or some analysis of good and poor passing or player positions. How about estimating the energy used by each player based on their positions and speeds throughout the game? Can you detect if there were any offsides? …
Download the data from here.
You can find a complete list of all the articles here. Click here to receive email alerts on new articles.
© 2009-2017 DataGenetics Privacy Policy