
RISK® Analysis
In my last blog posting, I talked about two techniques (Monte-Carlo simulation, Markov-Chain analysis) for calculating probabilities in the game of Chutes and Ladders.
Today, I want to take a look at the popular game of RISK®.
|
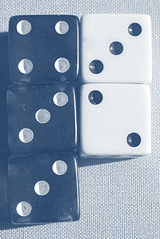
If you’ve not played the game, the core mechanic is based on the rolling of dice to determine wins/losses for armies attacking between territories. Battles occur in rounds, with an attacking player typically rolling (up to) 3 dice, and a defending player (up to) 2 dice. After rolling, dice are paired up (Highest rolled attacker die against highest rolled defender die, then next highest rolled pair if required). The highest rolled number wins (eliminating one opponent army), with ties resulting in a win by the defender. Attacks by more than three armies are played in a series of rounds. After each round, armies from the losing team are removed from the board and the remaining pieces continue to duel. The fact that it is the highest then the next highest die used for the two attacks makes a subtle twist in the probabilities. In more than a couple of internet searches I’ve found people have made mistakes in calculating the probabilities. So, how should we go about calculating the true probabilities? |
 |
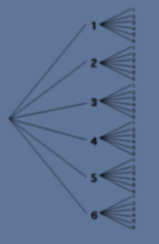 |
Following on from the last blog posting, we could do a Monte-Carlo simulation, and roll millions of sets of dice. The problem with this approach, however, is that we’d only get an approximate answer, and we’d also be at the mercy of our random number generator. First, we’ll look at the probabilities of a single round (with all permutations of possible attack and defence rolls). Later, we’ll apply this learning to multiple round battles. Since there are a small (fixed) number of dice with a finite set out outcomes, we could create a probability tree and work out the probabilities by hand, but being honest, this is a lot of work, with multiple chances of making a mistake, and incredibly tedious. |
Brute force of a basic round
When an attacker has three or more armies, he can roll up to three dice. (It’s pretty trivial to calculate that it’s always in the best interest of the attacker to roll as many dice as possible on each round, so this will be built in the calculations later). Similarly, it’s in the defenders interest to roll two dice where possible, and only rolling a single defence die when there is no option.
We still, however, need to calculate the probabilities for all five possible combinations of attack/defence combinations that could occur in a basic round: 3v2, 3v1, 2v2, 2v1, 1v2, 1v1.
Brute Force.The simple fact is that there aren’t that many combinations to examine. At worst case, there are only five dice rolled with a total of 7,776 combinations (6 x 6 x 6 x 6 x 6). We can simply loop through each possible combination of dice rolls and calculate the exact results.
 |
There’s no reason to be a prima donna and say that brute force is cheesy programming. Many times, the simplest algorithm is the best. Code for enumerating all combinations of dice is incredibly easy to write, easy to read, and very unlikely to contain logic errors (It honestly took me about two minutes to write code to generate the results). If I’d tried to do the calculation in a more "elegant" mathematical way (or even by hand) it would have probably taken two orders of magnitude longer to write and debug, and might still have had a logic or calculation error left in! |
It’s also not as if this piece of code is going to be executed millions of times. It’s going to be run just once. As a good friend of mine pointed out, there are entire sites on the internet where people argue about the most efficient and elegant algorithms to solve certain problems, but practically, is the difference between a great solution and a perfect solution worth the extra week it takes to develop?
Academically these algorithm discussions are noble (and don’t get me wrong, very, very interesting); in some core cases, where performance or memory usage is paramount, the value of an efficient and elegant algorithm more than justifies the indulgence. But often, it is easy to forget that all you need is the answer in the effort to engineer a graceful solution.
It's all about Horses for Courses
There is no shame in the appropriate use of a brute-force algorithm.
Algorithm
Here's the pseudo code for the case of three attackers vs. two defenders:
For Attack1 = 1 to 6
For Attack2 = 1 to 6
For Attack3 = 1 to 6
AttackHigh = Highest (Attack1, Attack2, Attack3)
AttackMedium = Medium (Attack1, Attack2, Attack3)
For Defence1 = 1 to 6
For Defence2 = 1 to 6
DefenceHigh = Highest (Defence1, Defence2)
DefenceLow = Lowest (Defence1, Defence2)
Calculate_Win_Loss_Tie (AttackHigh, AttackMedium, DefenceHigh, DefenceLow)
Next
Next
Next
Next
Next
That's pretty much all there is to it.
Results - Basic Battles
Here are the results of the brute force calculations for the various combinations of dice.
| Defender Rolls 2 Dice | Defender Rolls 1 Die | |||||||||||||||||||||||||||||
| Attacker Rolls |  |
|
||||||||||||||||||||||||||||
|
|
|
||||||||||||||||||||||||||||
|
|
|
||||||||||||||||||||||||||||
|
|
|
||||||||||||||||||||||||||||
Now it gets more interesting
Battles that occur when there are more than three attackers (or more than two defenders) are more complex to calculate e.g. A battle between seven attacking pieces and five defending pieces.
NOTE: When a player attacks, he must leave (at least) one army behind on the territory he is striking from. All my calculations are based on the number of characters doing the actual attacking, not the number of armies on the starting square.
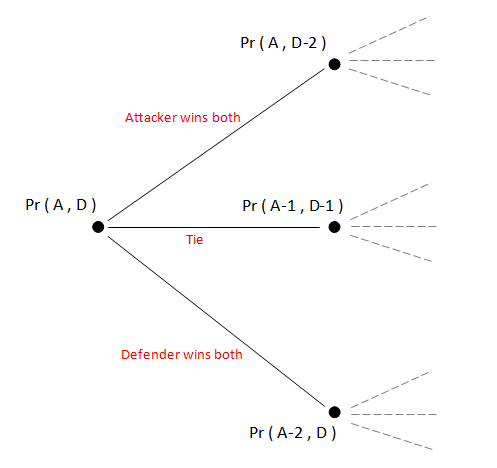
The tree diagram below shows the various possible outcomes for the above example:
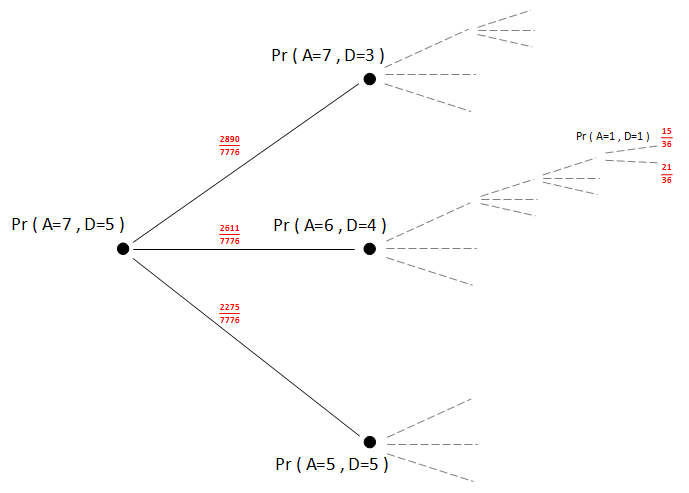
After the first round, the attacker could win both dice, reducing defending dice to three. or, both the attacker and defender could each lose an army, or the attacker could lose two armies. From the matrices above, the probabilities of these events happening are (respectively) 2890 / 7776, 2611 / 7776, 2275 / 7776. And, the probabilities of these events happening are based on probabilities of other events, and so on …
 |
To calculate the actual probability of the attacker being totally successful, we have to work our way through the tree, calculating the probability of each event happening all the way until we reach the leaf nodes on the end, which will be one of the five basic cases we calculated with brute force. There are many ways to calculate the sum of the tree probabilities, but one method that is easy to code, and easy to read is recursion. (See an earlier post of mine about creating spark effects using recusion. |
|
We can create a function that returns the probability of an attacker winning the entire battle based on the number of attacker and number of defenders specified. This function will add up the three probabilities: attacker wins, tie, and defender wins, calling itself recursively with the adjusted parameters for each of these cases. This function will call itself again until one of the known five basic cases is encountered. This condition is the end-case for our recursion, and the actual probability for this event will be returned by the function which will then ripple all the way back to the inital calling values. (Yes, yes, I know that recursion is far-and-away from being an optimal way of solving this problem. Infact it's harder to think of a less efficient algorithm for solving the problem! But, as above, if you only need to run it once, and get accurate results the first time, it's pretty hard to screw up the logic by writing the code in a recursive way. The entire function is just a few lines of code.) |
|
Results - Complex Battles
Here are the results in tabular format for all combinations of attackers and defenders up to 20. The percentages show the probability that the attacker will win the territory.
| Attackers | ||||||||||||||||||||
| Defenders | 1 | 2 | 3 | 4 | 5 | 6 | 7 | 8 | 9 | 10 | 11 | 12 | 13 | 14 | 15 | 16 | 17 | 18 | 19 | 20 |
| 1 | 41.667% | 75.424% | 91.637% | 97.154% | 99.032% | 99.671% | 99.888% | 99.962% | 99.987% | 99.996% | 99.998% | 99.999% | 100.000% | 100.000% | 100.000% | 100.000% | 100.000% | 100.000% | 100.000% | 100.000% |
| 2 | 10.610% | 36.265% | 65.595% | 78.545% | 88.979% | 93.398% | 96.665% | 98.031% | 99.011% | 99.420% | 99.709% | 99.830% | 99.915% | 99.950% | 99.975% | 99.985% | 99.993% | 99.996% | 99.998% | 99.999% |
| 3 | 02.702% | 20.607% | 47.025% | 64.162% | 76.937% | 85.692% | 90.994% | 94.680% | 96.699% | 98.110% | 98.839% | 99.349% | 99.603% | 99.781% | 99.867% | 99.928% | 99.956% | 99.976% | 99.986% | 99.992% |
| 4 | 00.688% | 09.130% | 31.499% | 47.653% | 63.829% | 74.487% | 83.374% | 88.780% | 92.982% | 95.393% | 97.204% | 98.199% | 98.932% | 99.321% | 99.605% | 99.751% | 99.857% | 99.911% | 99.950% | 99.969% |
| 5 | 00.175% | 04.913% | 20.594% | 35.861% | 50.620% | 63.772% | 73.640% | 81.841% | 87.294% | 91.628% | 94.304% | 96.370% | 97.581% | 98.498% | 99.015% | 99.401% | 99.612% | 99.768% | 99.851% | 99.912% |
| 6 | 00.045% | 02.135% | 13.370% | 25.250% | 39.675% | 52.068% | 64.007% | 72.956% | 80.764% | 86.109% | 90.522% | 93.354% | 95.611% | 96.991% | 98.065% | 98.697% | 99.180% | 99.455% | 99.663% | 99.779% |
| 7 | 00.011% | 01.133% | 08.374% | 18.149% | 29.742% | 42.333% | 53.553% | 64.294% | 72.608% | 79.983% | 85.205% | 89.612% | 92.541% | 94.929% | 96.441% | 97.644% | 98.377% | 98.949% | 99.287% | 99.547% |
| 8 | 00.003% | 00.490% | 05.350% | 12.340% | 22.405% | 32.948% | 44.558% | 54.736% | 64.641% | 72.397% | 79.412% | 84.486% | 88.857% | 91.838% | 94.318% | 95.933% | 97.242% | 98.063% | 98.715% | 99.112% |
| 9 | 00.001% | 00.259% | 03.277% | 08.617% | 16.156% | 25.777% | 35.693% | 46.399% | 55.807% | 65.006% | 72.303% | 78.988% | 83.916% | 88.227% | 91.231% | 93.772% | 95.466% | 96.861% | 97.758% | 98.482% |
| 10 | 00.000% | 00.112% | 02.075% | 05.719% | 11.828% | 19.343% | 28.676% | 37.987% | 47.994% | 56.759% | 65.383% | 72.284% | 78.676% | 83.457% | 87.696% | 90.704% | 93.284% | 95.038% | 96.504% | 97.465% |
| 11 | 00.000% | 00.059% | 01.255% | 03.917% | 08.292% | 14.698% | 22.187% | 31.173% | 39.987% | 49.395% | 57.629% | 65.762% | 72.319% | 78.447% | 83.088% | 87.248% | 90.246% | 92.848% | 94.647% | 96.169% |
| 12 | 00.000% | 00.025% | 00.791% | 02.555% | 05.942% | 10.721% | 17.331% | 24.704% | 33.375% | 41.749% | 50.650% | 58.430% | 66.140% | 72.395% | 78.284% | 82.790% | 86.869% | 89.845% | 92.457% | 94.290% |
| 13 | 00.000% | 00.013% | 00.475% | 01.725% | 04.079% | 07.963% | 13.039% | 19.735% | 26.971% | 35.338% | 43.328% | 51.787% | 59.174% | 66.515% | 72.501% | 78.172% | 82.551% | 86.547% | 89.496% | 92.107% |
| 14 | 00.000% | 00.006% | 00.299% | 01.111% | 02.875% | 05.679% | 09.956% | 15.221% | 21.943% | 29.026% | 37.110% | 44.756% | 52.827% | 59.869% | 66.884% | 72.629% | 78.102% | 82.359% | 86.273% | 89.189% |
| 15 | 00.000% | 00.003% | 00.179% | 00.742% | 01.941% | 04.142% | 07.321% | 11.889% | 17.277% | 23.980% | 30.904% | 38.723% | 46.062% | 53.788% | 60.524% | 67.248% | 72.775% | 78.065% | 82.208% | 86.040% |
| 16 | 00.000% | 00.001% | 00.112% | 00.473% | 01.351% | 02.901% | 05.486% | 08.964% | 13.753% | 19.211% | 25.868% | 32.631% | 40.204% | 47.264% | 54.681% | 61.144% | 67.605% | 72.934% | 78.055% | 82.089% |
| 17 | 00.000% | 00.001% | 00.067% | 00.314% | 00.900% | 02.085% | 03.958% | 06.871% | 10.589% | 15.540% | 21.034% | 27.624% | 34.230% | 41.572% | 48.379% | 55.516% | 61.732% | 67.956% | 73.103% | 78.068% |
| 18 | 00.000% | 00.000% | 00.042% | 00.198% | 00.620% | 01.438% | 02.920% | 05.081% | 08.273% | 12.182% | 17.252% | 22.755% | 29.265% | 35.717% | 42.844% | 49.419% | 56.302% | 62.293% | 68.300% | 73.280% |
| 19 | 00.000% | 00.000% | 00.025% | 00.131% | 00.408% | 01.021% | 02.073% | 03.833% | 06.248% | 09.675% | 13.736% | 18.890% | 24.381% | 30.804% | 37.106% | 44.031% | 50.393% | 57.043% | 62.829% | 68.637% |
| 20 | 00.000% | 00.000% | 00.016% | 00.082% | 00.279% | 00.696% | 01.510% | 02.788% | 04.803% | 07.441% | 11.066% | 15.246% | 20.457% | 25.922% | 32.251% | 38.410% | 45.145% | 51.310% | 57.746% | 63.343% |
Results in pictures
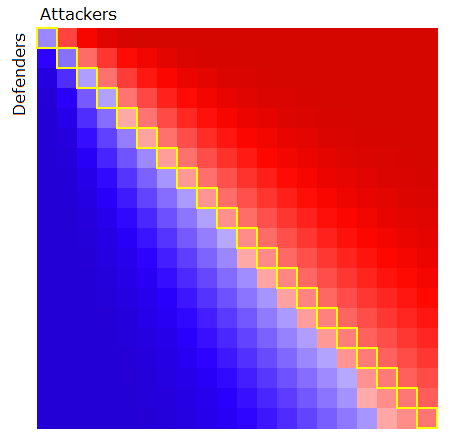 |
The above numbers are hard to read (and interpret), so here they are presented in a more digestable way. The picture to the left shows the same data, but this time I've shaded the matrix with colour representing the probability of the attacker winning. Where the percentage is >50% (advantage to the attacker), the square is shaded red. Where probability is to the advantage of the defender, the square is shaded blue. The darker the shade of colour, the higher the percentage advantage to that player. Squares on the leading diagonal (where the number of attackers and defenders is the same, are boxed in yellow. |
First look at results
With just a quick glance at the graph, we can notice some very interesting results, which should help generate some tactics.
With just a small number armies on both sides, the defender has the advantage. This is because, in the result of a tie on the dice, the defender wins.
For battles where the number of attackers and defenders is the same 1v1, 2v2, 3v3, 4v4, then the defender has the mathematical advantage. However, once 5v5 has been reached, advantage swings to the attacker (because the benefit or being able to roll one extra die each round becomes more significant than losing on a tie.
This attacker advantage widdens the larger the attacking army (you can see on the graph above that the further to the right you go, the more the red colour seeps below the yellow leading diaganol).
STRATEGY TIP – It's better to attack then defend. Be aggressive.
STRATEGY TIP – Always attack with superior numbers to maximize the chances of your attack being successeful.
STRATEGY TIP – If attacking a region with the same number of armies as the defender, make sure that you have at least five armies if you want the odds in your favour (the more the better).
|
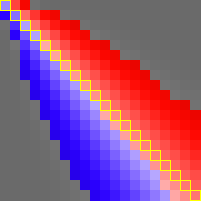
The image on the right shows the 95% confidence limits. All attacks in the top right gray area of the chart represent a victory for the attacker in at least 19/20 times. |
 |
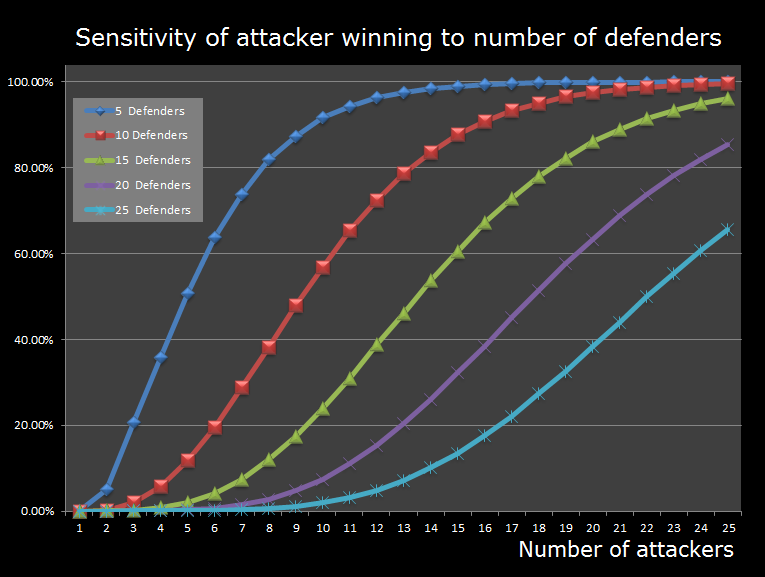
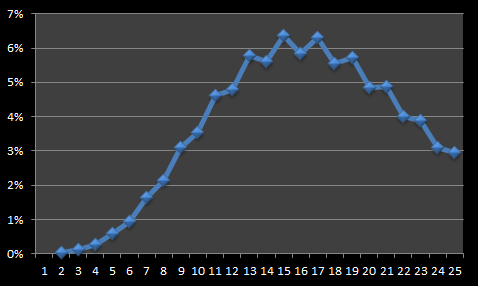
Here's another way to look at the data. The chart below shows the curves for the percentage chance of the attacker being successful. There are five different curves corresponding to 5, 10, 15, 20, 25 defenders
Advice for defenders
At the start of each round of the game, players are given additional armies that they can use to reinforce territories that are already owned. What is the optimal strategy for placing these new armies?
If the aim is to defend one particular territory then, as we've already learned, safety is in numbers. The stronger your defending force, the better your chance of defending. But, once you've reached five armies or more on a region, an identically sized attacking army has the advantage.
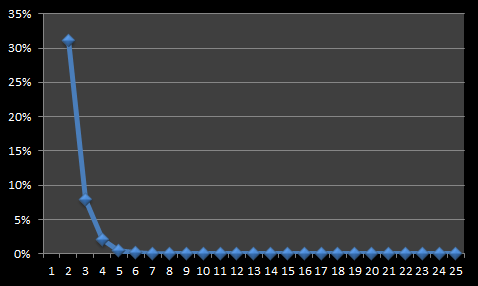 |
The graph on the left shows the change (delta) in the percentage chance of the defender holding onto a territory if being attacked by 1 attacker. The x-axis shows the new number of defenders, and the y-axis shows the change in percentage. As you can see, moving from 1 defender to 2 defenders, results in an increase in percentage chance of survival of 31%. Increasing this to 3 defenders adds only another 8% survival chance, and increasing this to 4 defenders another 4%. If you're only likely to be attacked by singletons, it's better to just double-up and use your extra armies elsewhere. |
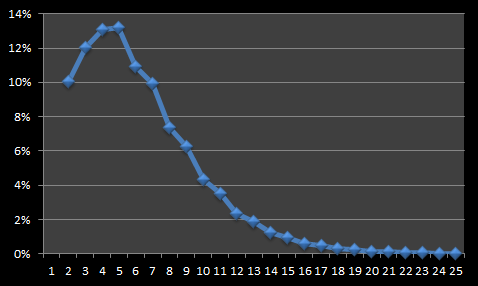 |
When defending against a potential attacking force of 5 attackers, the curve changes. The most "Bang for the Buck" is obtained by increasing the defence force to 5 (matching the attackers strength). The smarter readers will realise that these efficiency curves represent the gradient of the sensitivity curves. The most efficient placement of defences is where the gradient of this curve is the steepest. |
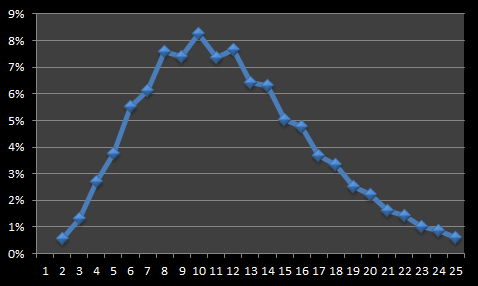 |
Similarly, when defending against a force of 10 attackers, the most efficient use of reinforcement is to get the number of defenders to the same level as the number of attackers. (The graphs start to become more noticeably 'spikey' because of an odd/even parity effect caused by the difference to the attacker of having either two or three dice left towards the end of the battle). |
 |
Finally, an example of the changes in efficiency per defender based on being confronted by 15 attackers. Again, the biggest increase from adding a single defender is moving from 14 to 15 defenders. |
STRATEGY TIP – It's better to double up defence on single territories than increase defences on large ones.
STRATEGY TIP – The most efficient reinforcement strategy is to try and get your regions up to the number of armies that you think your attacker will use against you.
 |
RISK® is a product owned by Hasbro. You can find out more details about the product range, and buy products from their website |
You can find a complete list of all the articles here. Click here to receive email alerts on new articles.
© 2009-2013 DataGenetics