
Bertrand's Ballot and Soccer Games
 |
My son likes to play soccer (or football, as I still call it). Recently his team scored a victory: 4 – 3. Here’s a question for you: What is the probability that his team was ahead the entire game? |
Ballot Box
|
This is a similar question to voting. If there are two candidates being voted on for some election, and p people vote for the first candidate (who wins), and q people vote for the losing candidate, what is the probability that the first candidate is always winning if the votes are counted one by one. Analysis of these problems is given the name Bertrand’s Ballot Theorem, after the French mathematician Joseph Louis François Bertrand. |
 |
 |
These questions are equivalent. If we had a time machine, and could skip the end of the event, it does not matter the path to get there. The number of votes is sum-certain, and the final score is, well, the final score. The order of how the goals are scored is not important to the final result. The results are path independent (what physicists like to call a conservative field). If you are counting the results of a vote, it does not matter if you total up all the votes for one party, then the other, or do it at random, you are going to get the same outcome. |
|
Whilst the final score is independent of the path, during the the game we might see swings in either direction. What we're looking for is the probability that my son's team is always in the lead. Out of all possible ways the scores could be formed, what percentage have this constraint? It's the same with the voting example. As we pull out votes to make a running tally, what percentage of ways that the ballots can be pulled out results is a running total that keeps the intermediate winner the ultimate winner? |
 |
Returning to Soccer
If the final score of my son's game was 4-3, we know that a total of seven goals were scored. If I describe my son’s team with the letter A, and the opposing team with the letter B, we can create a string of the possible scoring events (arranged chronologically from left to right). Here are some examples:
| AAAABBB |
In this first example, my son’s team scored all their goals first, then the opponents scored all theirs. Team A was always winning. We started in the lead, and never lost it. |
| BBAABAA |
In this example, the opponents scored a couple first, then we equalized, then the opponents scored again, then we equalized. We were never ahead until the final goal of the game, and we were behind (not just tied) at various times too. An exciting game! |
| ABABABA |
Here we were ahead, or tied. Alternating. We were never behind. |
| AAABABB |
After an early lead, even with a goal scored against us, we were ahead the entire game. |
Closer Look
 |
Let's take a closer look at all the possible results of a 4-3 game. There are 35 possible permutations for the way that a game of this final score could occur. These are enumerated below. The second column in the table below shows the scoring pattern. The third column 'Always Win' shows if team A was winning throughout the entire game (Never being behind, and never tied). The fourth column 'Win or Tie' indicates if team A was never in a losing position in the game (Always ahead, or tied). The final column shows the highest and lowest goal difference experienced in that game. |
Developing Score: The fifth column shows the state of the game as it progresses (chronologically from left to right) after each goal. A Green shading represents Team A currently winning, a Gray shows that that goal ties the game, and a Red shows that that goal put Team B ahead.
As a parent, cheering on your little ones on, games that are green, or a mixture of green and gray, are not as stressful to watch as ones with red. A red block shows you that, at some time, you were losing.
Permutations of Scoring
| Always Win | Win or Tie | Max/Min GD | |||
|---|---|---|---|---|---|
| #1 | AAAABBB | YES | YES | A A A A B B B | +4 / -0 |
| #2 | AAABABB | YES | YES | A A A B A B B | +3 / -0 |
| #3 | AAABBAB | YES | YES | A A A B B A B | +3 / -0 |
| #4 | AAABBBA | YES | A A A B B B A | +3 / -0 | |
| #5 | AABAABB | YES | YES | A A B A A B B | +3 / -0 |
| #6 | AABABAB | YES | YES | A A B A B A B | +2 / -0 |
| #7 | AABABBA | YES | A A B A B B A | +2 / -0 | |
| #8 | AABBAAB | YES | A A B B A A B | +2 / -0 | |
| #9 | AABBABA | YES | A A B B A B A | +2 / -0 | |
| #10 | AABBBAA | A A B B B A A | +2 / -1 | ||
| #11 | ABAAABB | YES | A B A A A B B | +3 / -0 | |
| #12 | ABAABAB | YES | A B A A B A B | +2 / -0 | |
| #13 | ABAABBA | YES | A B A A B B A | +2 / -0 | |
| #14 | ABABAAB | YES | A B A B A A B | +2 / -0 | |
| #15 | ABABABA | YES | A B A B A B A | +1 / -0 | |
| #16 | ABABBAA | A B A B B A A | +1 / -1 | ||
| #17 | ABBAAAB | A B B A A A B | +2 / -1 | ||
| #18 | ABBAABA | A B B A A B A | +1 / -1 | ||
| #19 | ABBABAA | A B B A B A A | +1 / -1 | ||
| #20 | ABBBAAA | A B B B A A A | +1 / -2 | ||
| #21 | BAAAABB | B A A A A B B | +3 / -1 | ||
| #22 | BAAABAB | B A A A B A B | +2 / -1 | ||
| #23 | BAAABBA | B A A A B B A | +2 / -1 | ||
| #24 | BAABAAB | B A A B A A B | +2 / -1 | ||
| #25 | BAABABA | B A A B A B A | +1 / -1 | ||
| #26 | BAABBAA | B A A B B A A | +1 / -1 | ||
| #27 | BABAAAB | B A B A A A B | +2 / -1 | ||
| #28 | BABAABA | B A B A A B A | +1 / -1 | ||
| #29 | BABABAA | B A B A B A A | +1 / -1 | ||
| #30 | BABBAAA | B A B B A A A | +1 / -2 | ||
| #31 | BBAAAAB | B B A A A A B | +2 / -2 | ||
| #32 | BBAAABA | B B A A A B A | +1 / -2 | ||
| #33 | BBAABAA | B B A A B A A | +1 / -2 | ||
| #34 | BBABAAA | B B A B A A A | +1 / -2 | ||
| #35 | BBBAAAA | B B B A A A A | +1 / -3 |
There are a couple of obvious take-aways from this:
If you concede the first goal, you can never be ahead the entire time!
Similarly, to have a chance at always being ahead, you need to score the first two goals.
The last square has to the green (By definition to win the game you need to be winning at the end!)
Not being in a losing position at any time occurs more frequently than winning the entire time!
The maximum (positive) goal difference is when Team A scores all their goals first, and the lowest (negative) goal difference is when Team B scores all their goals first.
Further Examples

|
If you want to see a couple of more complicated examples, here are tables for a 7 – 3 scoring game, and a 7 – 6 scoring game.(Links open in a new window). |
Bertrand's Theorem
 |
As you can see from the table above, of the 35 possible permutations that the game can be scored, my son's team was ahead the entire game in five of these ways. If we knew just the final score, we could calculate the probability that his team was ahead the entire time at 5/35, which simplifies to 1/7. The number of games in which his team was never in a losing position is 14/35, simplifying to 2/5. Again, knowing just the final score we can determine the probability his team was not in a losing position during the entire game. A mathematical way to calculate these percentages was first published by an English priest and mathematician William Allen Whitworth, but is named after Bertrand, the Frenchman who rediscovered it a few years later. |
There are two formulas. The first calculates the chance that the winning team is always ahead, the second is used to calculate the percentage that the first team is never in a losing position. Here a is the number of goals scored by Team A, and b is the number of goals scored by Team B.

There are many ways this theorem can be proved, and there is no point in duplicating the proofs here. There are many excellent sources of information on the web including this one, which derives it in four different ways.
These formula confirm our observations:
PrWIN = (4-3)/(7) = 1/7
PrNOTLOSS = (4+1-3)/(4+1) = 2/5
Graphs
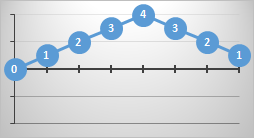
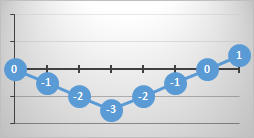
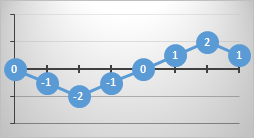
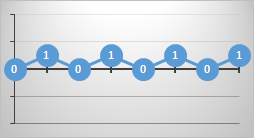
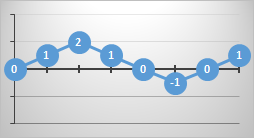
It's possible to plot the games on a graph where the x-axis shows the number of goals scored as the game progresses, and the y-axis shows the current goal difference. Here are some examples (the numbers represent the current goal difference):
 |
 |
 |
 |
 |
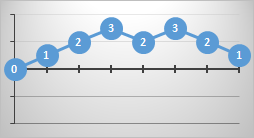 |
At the end of the game the paths all finish at the same location (the final score is fixed and conservative), but there many possible ways to get there.
The paths that never cross below the x-axis are paths where the winning team is never in a losing position. These games always have a positive goal difference. If they touch the x-axis at any point, this means the scores were tied at that point.
Paths that never drop below the x-axis, and never touch it after kick-off, represent games where the winning team was always in a wining position throughout the entire game. Paths that cross the axis and go negative for a while represent games in which the ultimate winning team was losing at that point.
Possible Ideas?
 |
In preparing this article it became clear to me that some games are more exciting than others. Some games are 'nail-biters', in which there is a lot of vacillation between who is winning, others are more relaxed in which there is an early lead which is never lost. I wonder if it would be possible to derive a formula for a first order approximation for a measure of how exciting a game is to watch? As we've seen, it's not just the ultimate goal difference (which dictates the overall winner), and it's not just the maximum and minimum goal difference seen during the game. It's a more complex recipe related to the transition and progression between the start and ultimate score. |
You can find a complete list of all the articles here. Click here to receive email alerts on new articles.

© 2009-2014 DataGenetics Privacy Policy