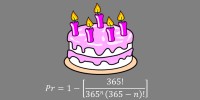
Birthday Paradox Revisited
One of most well known mathematical ‘paradoxes’ is the Birthday Paradox.
It’s not really a paradox; it’s more accurately described as an unexpected and non-intuitive result of the pigeonhole principle. If you’ve not heard about it, it goes something like this:
How many people do there need to be in a room so the there is a greater than 50% chance of at least two of them sharing the same birthday?
At first blush, answers tend to be “a lot”, or “about 182” (which is 365/2), but these answers fall into the trap that people are thinking about sharing a particular birthday, not any birthday. There are lots of combinations possible; each person has to compare themselves to every other person, not just one date.

The answer is that, with 23 people in a room, there is a greater than 50% chance that at least two of the people will share the same birthday.
Advertisement:
Explanation
As mentioned, the easy way to think about this is through the thought process of the pigeonhole principle. If there are 365 people in a room, each with a distinct birthday, there is no way to add another person to the room without them colliding with the date of someone already in the room; every date is taken.
As a thought experiment, we can imagine people entering the room, one at time. Imagine there are 365 pigeon holes in the room (one for each day of the year) into which each person, upon entering the room, places their hat. If there is a hat already in that pigeon hole, there is, at least, one other person in that room already with the same birthday.
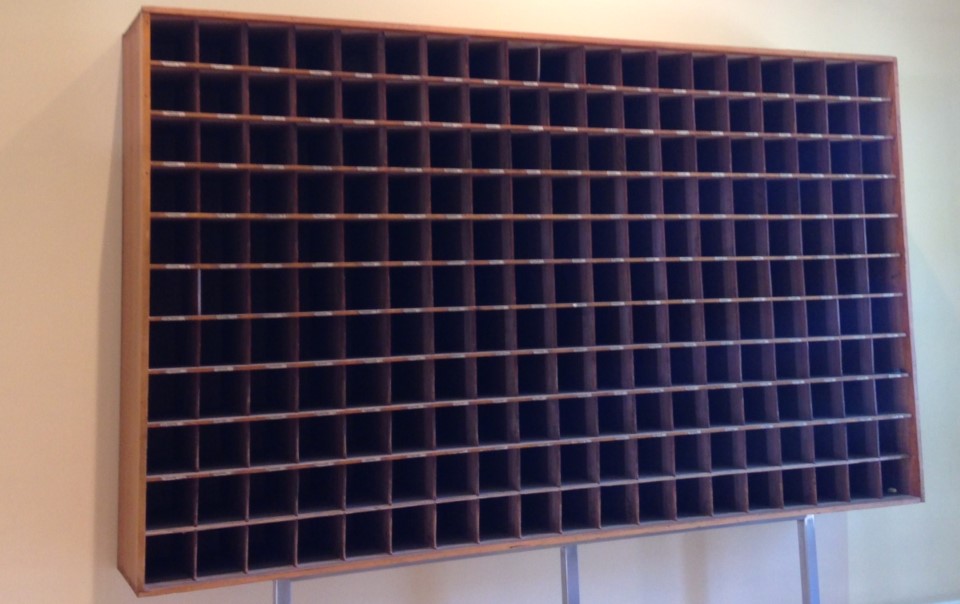 Image: pru_mitchell
The first person to enter a room will, by definition, have a unique birthday. They can place their hat in any of the pigeonholes (365/365).
The second person entering the room will be able to place their hat in any one of the remaining 364/365 free slots to be different. Logically ‘anding’ these two hat placements we get (365/365 × 364/365), and this gives the chance that both people find a free slot. If the second person did not find a free slot, there has been a collision.

With three people, there should be 363 free slots for the third person's hat. The first person had 365/365 options, the second person 364/365, and the third person 363/365 chances their birthday does not match the first two. If everyone finds a free slot then there are no clashes. The opposite (complement) of everyone finding a free slot means that there was at least one collision. This can be calculated by subtracting, from one, the chance of no clashes:
1 − (365/365 × 364/365 × 363/365)
With four people, the probability that everyone can find an empty slot to place their hat is 365/365 x 364/365 x 363/365 x 362/365. Again, if everyone is not able to find a free slot, this means that there has been at least one collision (which is what we are trying to find).
1 − (365/365 × 364/365 × 363/365 × 362/365)
I’m sure you can spot a pattern here …
Which can be simplified into this equation:

Graph
Here is the data plotted for the first few values of n (the number of people in the room).
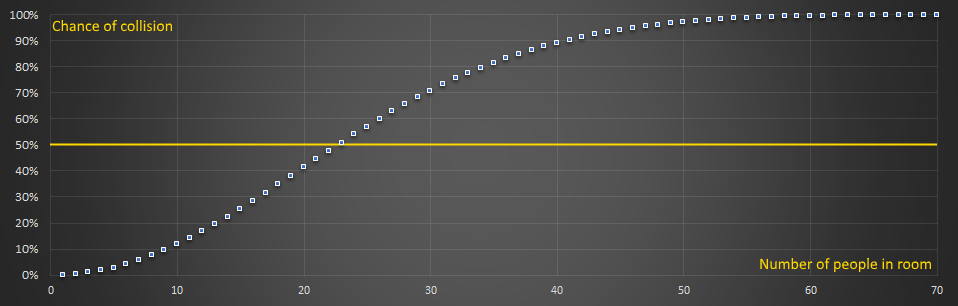
You can see that by the time n>60, we're already in excess of 99%, and by the time n=23 we are over 50% (which is our answer).
Here is some of the data in tabular format:
| People | Percentage Clash |
|---|---|
| 1 | 0.000% |
| 2 | 0.274% |
| 3 | 0.820% |
| 4 | 1.636% |
| 5 | 2.714% |
| 6 | 4.046% |
| 7 | 5.624% |
| 8 | 7.434% |
| 9 | 9.462% |
| 10 | 11.695% |
| 20 | 41.144% |
| 23 | 50.730% (First over 50%) |
| 30 | 70.632% |
| 40 | 89.123% |
| 50 | 97.037% |
| 60 | 99.412% |
| 70 | 99.916% |
| 80 | 99.991% |
| 182 | 99.99999999999999999999990466% |
The numbers very rapidly get close to something an atom away from a sure thing. With 182 people in a room (remember, approx half of 365?), we're past '26 nines'.
Real Data
The above analysis is based on the assumption that every birthday is equally likely. We know, however, that this is not the case. There is a non-uniform distribution of birthdates in the year. Below is a heatmap from Matt Styles that went viral a couple of years ago.
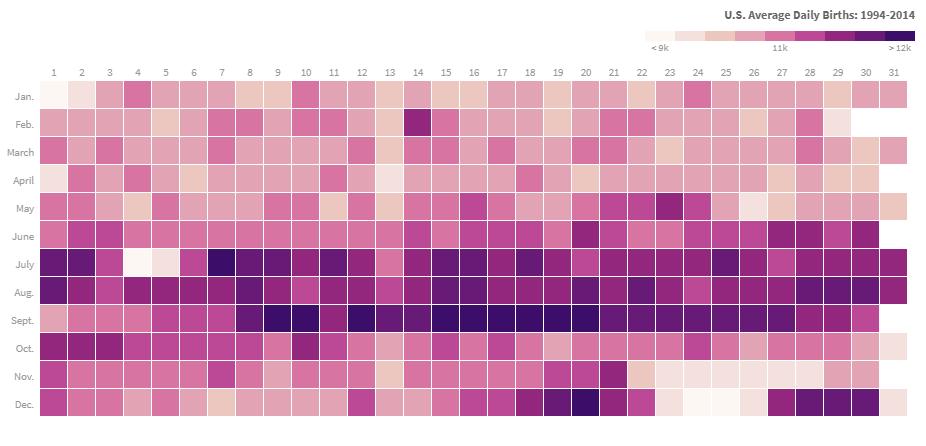 Image: Matt Styles
I wanted to know if the non-uniformity of distribution had an impact on the probability. Does using real data produce a measurable difference?
First, I needed a source of data, so I pulled data from the SSA administration, which has birth record data online. I used data from 2000-2014, a total of 62,187,024 births. However, in the interest of not having to deal with leap years, I ignored February 29th births and so am simply comparing 365 days of live births against 365 equally distributed dates. This reduces the sample to 62,145,155.
If you want to play along at home, here is the raw data I used: Data Source
I'm aware this data source is USA biased, as you can see from the following plot of the data:
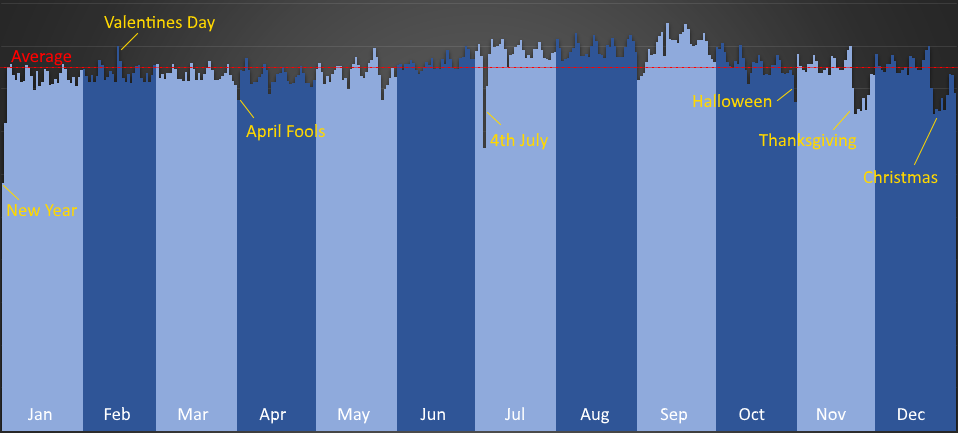
You can see the average line, and there is a swell in births mid-June to September (peaking in September), I'll let you do the math and subtract off nine months from these dates and draw your own conclusions!
You can also see the measurable effect that elective birth dates have on the data. Inducing a birth allows flexibility a few days either way, and this allows time scheduling to avoid under-staffed holidays, and also some vanity dates (There is a peak on Valentine's Day, but a drop on April Fool's Day, and Halloween).
You can see a huge drop on 4th July, Christmas, and Thanksgiving (with rises the couple of days before the latter two of these longer breaks, to get some of them out of the way). There's also small dips around Labor Day (how ironic), Memorial Day, and Columbus Day.
Effect
Loading this data in, I used Monte-Carlo analysis to randomly select groups of people from this sample to shovel people into a room, in various groups, and checked for clashes. I ran the experiment one billion times (enough to find out if there was a measurable difference), but I appreciate I'm at the liberty of my random number generator (to test this, I also ran the experiment using the random number but over uniform distributed of birthdays to help gauge the effect of this. There was variation in these answers too over the theoretical, suggesting my random number generator was not great, and that I didn't use a large enough sample size, but smaller differences those obtained from the non-uniform data).
The result is that the non-uniformity does have an impact effect, but it's very, very small. When there were four or less people in the room, from my experiments, the non-uniformity of distribution resulted in a slight decrease in the chances of a birthday collision (but this could loss of precision from too small a sample size as the percentage of times, for instance that two people collide is just 0.274%). After five people, the non-unformity provided a slight increase in the chances of all collisions. This is what I would expect.
However, the effect is so small, it could be best described as a fraction of a percent.
Why?
Why would I expect non-uniformity to increase the chance of collisions?
The reason is because of the effect of the Inspection Paradox. The more people there are who have a particular birthday, the more the chances there are for having two people matching.
Let's simplify this to just two people (A & B), and rather than using birthdays, let's use a coin flip. Both players flip a coin, and if they match (both heads or both tails), they win. If the coin flips are unbiased, there is a 50% chance that they will match.
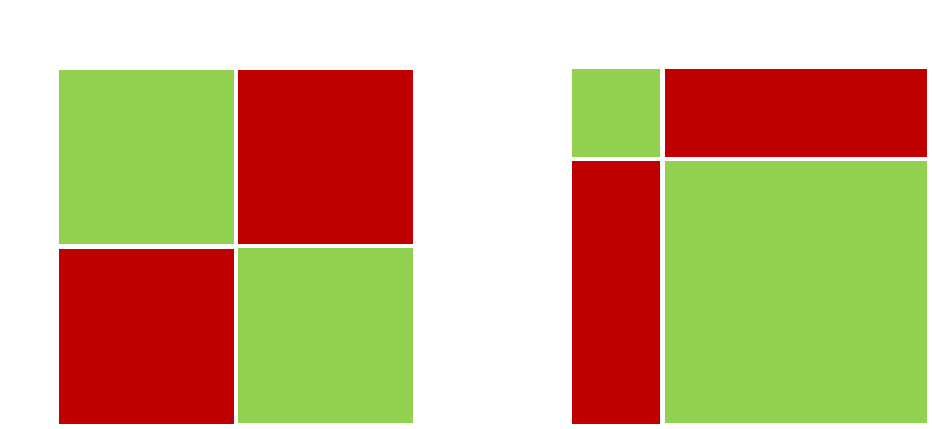
Now imagine the coins are biased, and land heads ¾ on each flip. Now there is a more chance that both players will flip heads.
Above are two pay-off matrices. The green areas are the wins (both matching). The matrix on the left shows an unbiased coin, the one on the right the biased coin. The bigger the bias, the more the chance they match. The larger the bias, the larger the area of green.
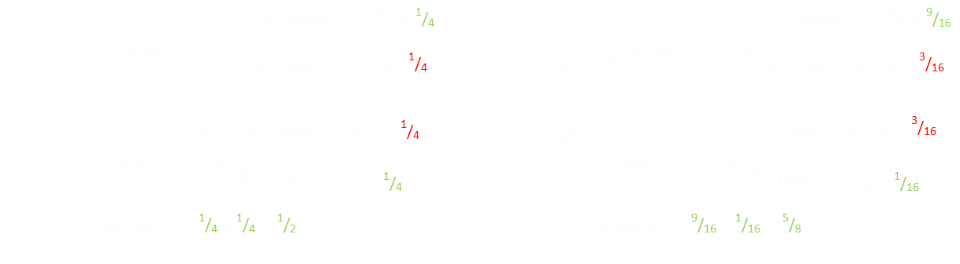
Drawing these two examples as tree diagrams:
The inspection paradox is all around us. If you go to a school and ask students how big their class sizes are, then average their answers, you'll get a certain value (eg. 31 students), but if you check the school records you'll find the answer is much smaller (eg. 20 students). Why?, were the students lying? They both can't be right!
The issue, of course, is that the when you are surveying students, you are over-sampling the larger classes. When you query the students in a large class, you are getting a lot of answers of a large number.
When at a supermarket, if there are excess check-out staff, you never have to wait, but as there are fewer customer, less people enjoy this expedited service. It's only when there is a shortage that you feel the pain.

One of the most famous examples of this is given the name "The Friendship Paradox". On Facebook, people have fewer friends, on average, than their friends have. If you select a random person on Facebook, then select one of their friends at random, it's much more likely that this person has more friends than the random person. This is the inspection paradox; when you select a person at random, every user is equally likely, but when you choose one of their friends, you are more likely to choose someone with a lot of friends (which is how the first person had them as a friend).
Related topics
A related problem is that of baseball card collecting.
Imagine you decide to collect baseball cards, and there are 50 cards in a complete set. Let’s imagine that these baseball cards are sold in individual sealed packs (one card per pack), and that the supply of packs is practically infinite and thoroughly shuffled so that there is an equal, random, chance of any card being in any pack selected. What is the expected number of packs you’d need to purchase in order to get a full set?
What is the expected number of cards you must purchase to get a complete set?
You can read more about this in this article.
Answer: For a 50 card set, the answer is 225 (see article above for derivation).
Another couple of related problems are How to escape from monsters using a holographic replicator and How best to distribute lottery tickets.