How much traffic does a blog get?
Now that 2018 has been put to bed, I wanted to share some data.
I’ve been blogging for close to ten years now, and I’ve always been very curious about how my traffic compares to other bloggers. Google searches reveal very little hard data, with most hits resulting in people pontificating with “it depends”, or search results filled with bogus advice about how to make money through blogging, or how to improve your blog traffic (without actually giving information about what traffic they started with nor, paradoxically, any data to backup their claims, as an expert, about how their own advice applied to their own blog!)
In an effort to break this cycle, I’d like to share my traffic data for 2018. Hopefully, as the search spiders crawl my site, it will index this page with the relevant keywords.
If any other bloggers want to share a summary of their data, drop me a note (or post on my facebook page), and I’ll build a database. If I receive more than a handful of responses, I’ll publish an update article later this year.
Happy New Year!

Advertisement:
2018
In 2018, I finished the year after delivering approximately 1.2 million page views. This is down slightly on last year, which was 1.8 million. This ‘decline’ is not a bad thing. As anybody who runs a blog will tell you, web traffic is incredibly spikey. Getting an article published on a popular news site will bring a supernova of traffic. Supernova traffic is incredibly spikey; it burns incredibly bright, then rapidly fades away. Sure, you hope that a percentage of these fresh-eyeballs like what they saw enough to come back (either through a book mark, RSS feed, subscription, memory …), but the vast majority of traffic brought in from a headline tends to be a single date. In 2017 I got a couple more supernovae which is the reason for the higher number that year.
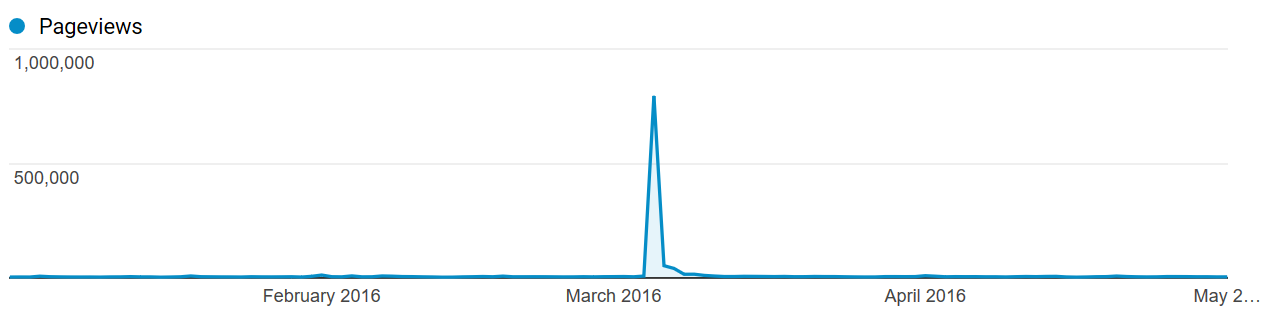
Here's a graph of daily Page Views from a supernova event in 2016. You can see I received close to a million page views on a single day, some slight residual for the days after, then quickly back to my, quiescent, baseload of a couple of thousand a day.
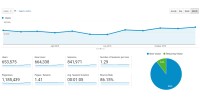
Here's a summary screen capture taken directly from my Google Analytics account for all 2018, by month:
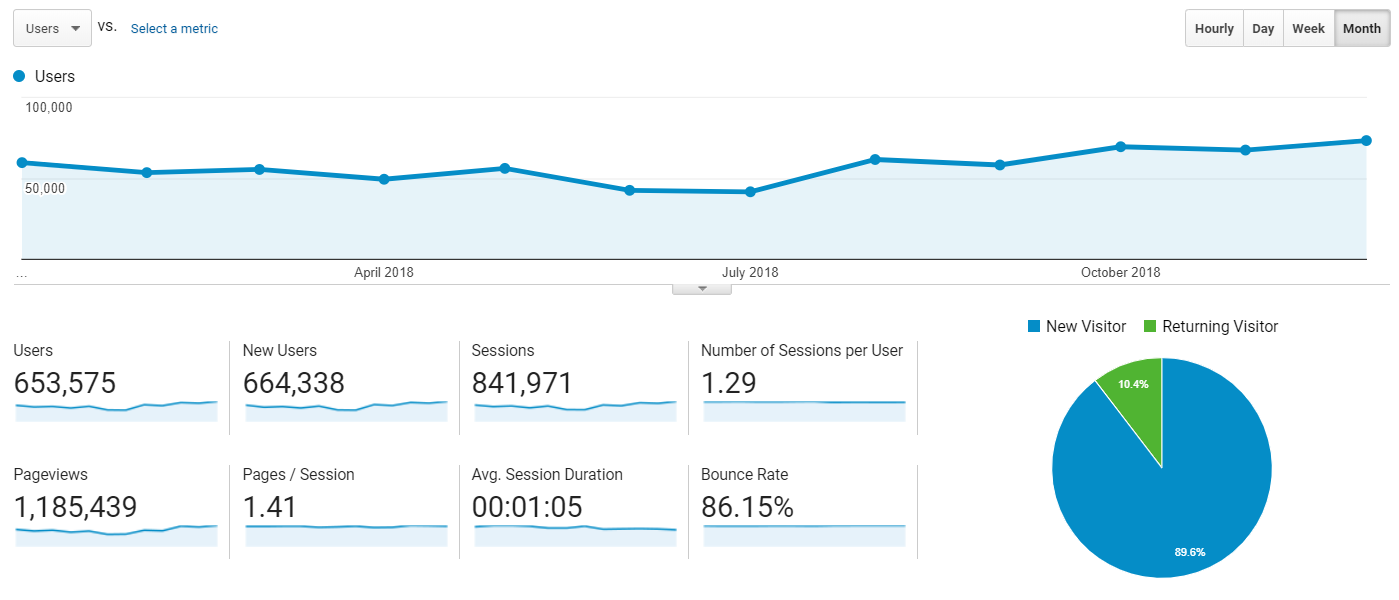
1.19 million PVs, over 841, 971 sessions.
Platform
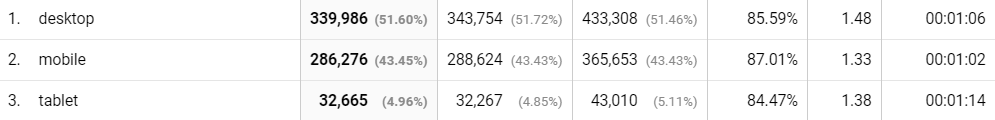
The World is moving mobile. Even though I'd consider my site to be one best consumed sitting at a desktop in a comfy chair with a premium hot beverage of choice, as you can see, almost as many people access my site from a mobile or tablet as from a desktop/laptop.
For this reason, I finally updated my site to a responsive design template so that it looks as good on a small screen format as it does on a desktop. Hopefully this will have additional SEO dividends as I understand that Google ranks sites lower that are not mobile friendly (in fact, when I run queries on my own site, Google even politely informs me when my pages are not mobile friendly).
Browsers
What is the browser breakdown? As you can see, Chrome is the modal browser accessing my site at just over 58%. This has been creeping up, slowly, over the years (at the percentage detrement to all other browsers). Internet Explorer and Edge (combined), can't make double digits. In fact, the last time IE had a double digit percentage of my browser traffic was back to December 2012. When I first started blogging IE was about 33% of my traffic (but I was working for Microsoft at the time, so there could be some bias there in my readership!)
My, how the mighty have fallen. Back when I worked in MSN Games, Internet Explorer had 90%+ of the browser market, and we had to debate hard if we should continue supporting Netscape with its small, residual, balance of the market share. Fast forward a few years, and the IE Monopoly was gone (gradually, then suddenly). However you want to explain it: either out-execution by the new competition, or complaisance from Microsoft in relaxing and taking their eye of the ball, or a Microsoft image issue, but this has to be one of the biggest failures in modern tech history. On Windows, the dominant OS during this decline, you had to go out of your way to get another browser on your machine (sometimes quite hard).
There was a browser, installed by default, on every machine shipped, yet still, a massively large percentage of the World went out of their way to install another browser instead rather than use IE.
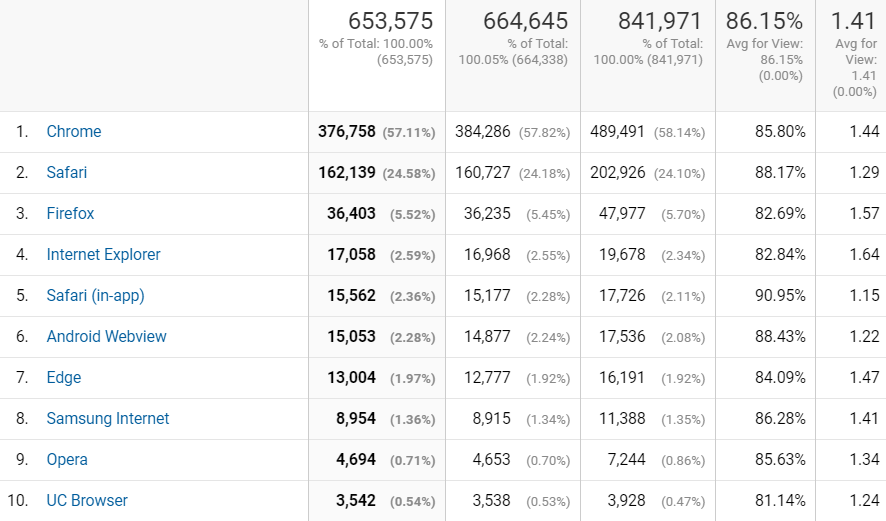
After the top half dozen, the rest of browser traffic is noise. It is, however, fun to read through and look at the obscure browser agent strings (Congratulations to the eight sessions in 2018 from people who accessed my site from the Nintendo 3DS browser!)
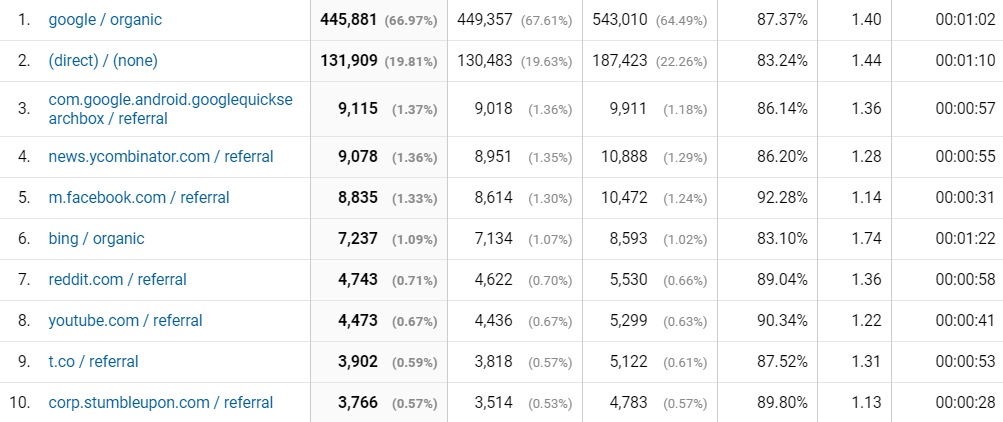
Traffic Sources
Over two thirds of my traffic comes from organic web searches (breakdown later). Another 20% comes direct (landing directly from clicking on a link, or from a referrer not trackable). Hacker News, Reddit, YouTube, and Twitter (t.co) pass through referring data that Google analytics can attribute).
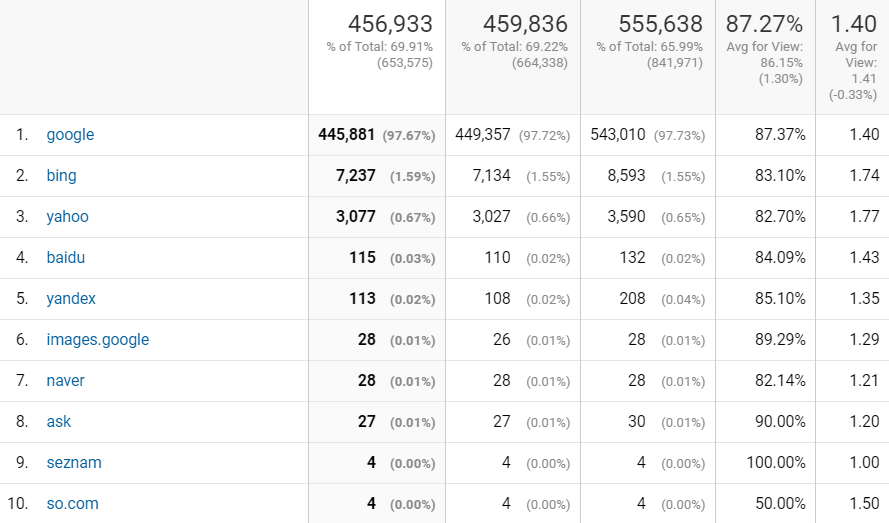
Search Traffic
For search, it's a one horse race. 98% of my site traffic from search engines is provided by Google. I do all I can with the other engines; I have sitemanger accounts, upload sitemaps, and provide all the hints I can, but it's pretty much game over for all other search engines. Providing all the help you can is no help if nobody uses the engines.
I hate to drive nails into coffins, but I can see why Google dominates. Nevermind the brand recognition and verbification of "Google", but simply the quality of the results. I really try with other engines, but even when I attempt to use Bing myself on my queries, I just don't get the same quality of results as I get from Google.
Most Popular Pages
Below are the top 100 pages from my site in 2018. This, of course, does not just list articles published in 2018, but contains page views of articles published, whenever, on the site. Some of my most popular pages are evergreen, getting a regular base load from search engines, even years after their publication date. Some are there because of supernova events pushing them into a top page for the year.
As you can see, my homepage, and also the page that contains a directory of all my articles, are in position #9 and #3, respectively, reinforcing the fact that people are coming to my site deeply, landing on the page they need from a search engine, rather than visiting my home page and navigating down.
A couple of the pages appear to be present more than once, this is because they are results pages. For instance the Wheel of Fortune solver page is two pages, the first contains the input form for the data, and the second is a PHP results page.
Interestingly, out of 1.2 million page views, my privacy policy page was viewed just over 200 times in the entire year! There's a link to this on every page, and it's easy to find. I know why it's important to have this disclosure, and as someone who is a member of the International Association of Privacy Professionals, I need to fly the flag, but considering there have been a couple of hundred thousand visitors to my site over the last year, it's an amazingly small fraction of a fraction of a percent of traffic. Privacy is something that people care about when it's breached, but not something they pro-actively care about. I've written about this in the past, but I think privacy is the wrong terminology to describe this. It's more about the concept of trust, not the concept of privacy.